Area Chart and Description by Subject – Competitive Advantage Analysis
RJ0500029_20
- Last Update 06/15/2025
- File Size 0.3MB
- # of Slides 2
- File Format PPTX
- Slide Ratio 16:9
- Color
Keywords
About the Product
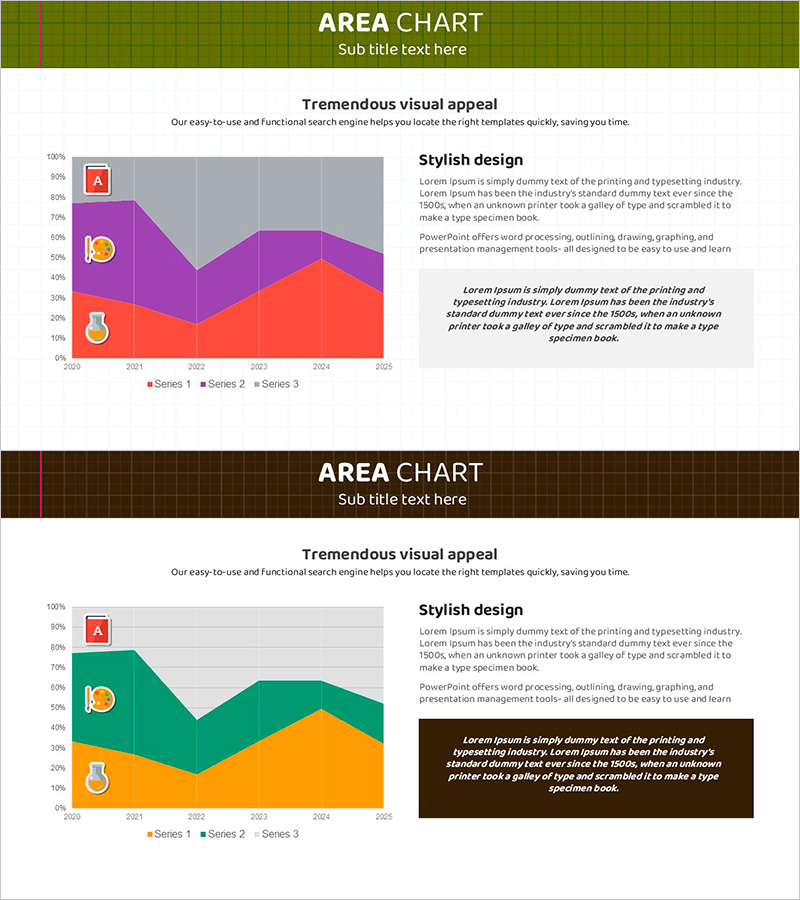
A stacked area chart PowerPoint slide for comparing time-series data across three data series from 2020 to 2025. The slide features olive, purple, and orange color-coded cumulative area graphs with a left-side legend and right-side text explanation area. Ideal for competitive advantage analysis, market share trends, and business performance presentations. This ready-to-use slide deck supports multi-series data comparison and is perfect for executive presentations and investor pitches.
Usage Points
-
Main Usage
Visualizes multi-series time-series data comparison using a cumulative area graph. The slide simultaneously displays overall magnitude changes and individual series proportion shifts, effectively communicating competitive advantage, market share trends, and business performance metrics.
-
How to Use
Identify each data series (Series 1, 2, 3) using the left-side legend. Enter analysis content and insights in the right-side text area. Replace chart data with actual figures for investor presentations, executive reports, and market analysis slideshows.
-
Recommended For
Recommended for investor relations materials, marketing team market analysis presentations, strategic planning meetings, and business performance reports. Particularly suited for presentations requiring multi-data comparison and trend analysis.
-
Slide Structure
2-slide set featuring two stacked area chart variations with olive, purple, and orange color combinations. Each slide is divided into three sections: left legend area, center chart area, and right text explanation area for balanced data and interpretation layout.
Related Products
-

Sports Vertical Bar Chart – The Perfect Choice for Performance Analysis
#Business Strategy #Market and Competitor Analysis #Graph
-

Sports Future Expected Effects and Numerical Graphs
#Market and Competitor Analysis #Graph #Other
-

Business Analysis Chart – Visualizing Competitive Advantage
#Market and Competitor Analysis #Graph #Other
-

Pencil Horizontal Chart Competitive Advantage - Visualizing Market Status
#Market and Competitor Analysis #Graph #Other
