Area Charts and Learning Tool Icons – Essential Slide for Market Analysis
RJ0500027_7
- Last Update 06/14/2025
- File Size 0.9MB
- # of Slides 2
- File Format PPTX
- Slide Ratio 16:9
- Color
Keywords
About the Product
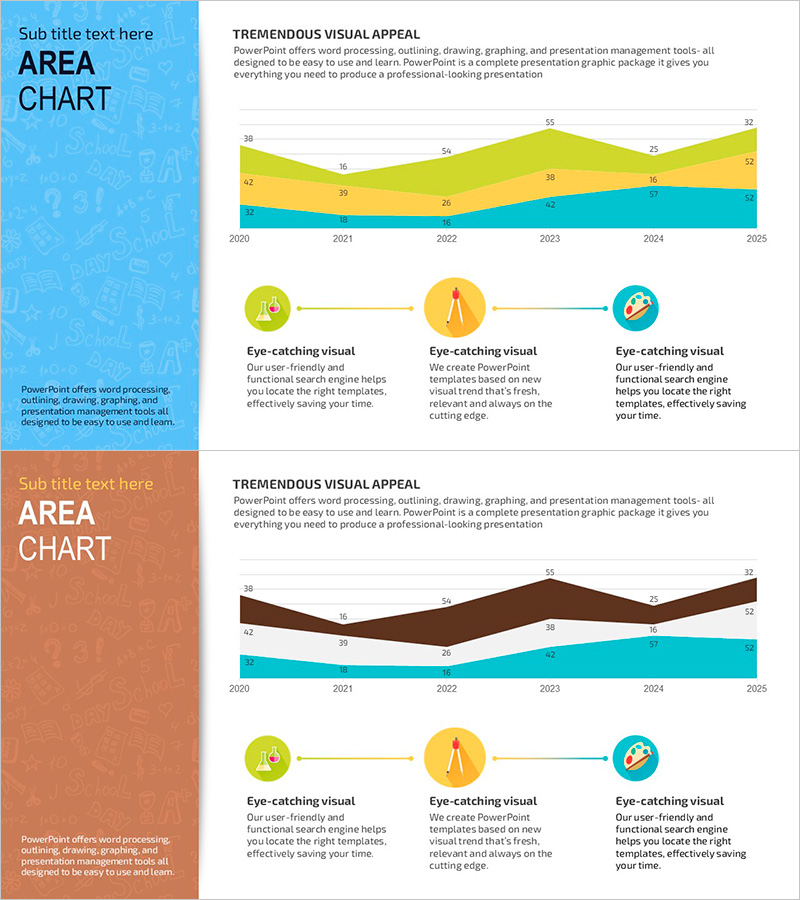
An area chart PowerPoint slide optimized for market analysis and data visualization. This slide deck features two stacked area chart designs (blue background, brown background, light blue background) displaying six-year trends from 2020 to 2025 across three data layers. Each slide includes a title input area in the upper left, descriptive text space on the right, and three circular icons with explanatory text at the bottom, making it suitable for market overview, competitive analysis, and target market analysis presentations. The slides are fully editable in PowerPoint for immediate use.
Usage Points
-
Main Usage
Presents market trends, competitive positioning, and target market analysis by comparing three data layers over time. Stacked area charts effectively show both total volume and individual component changes, making them ideal for market insight presentations and strategic decision-making.
-
How to Use
Enter your analysis topic (e.g., market share, customer segments) in the left title area and add analysis findings in the right text space. Replace chart legends and values with actual data, then complete the slide by adding key insights in the three icon description areas below.
-
Recommended For
Ideal for executive reports, investor presentations (IR), business plans, marketing strategies, and market research presentations. Best suited for executives, marketing managers, business development professionals, and data analysts who need to support decisions with data-driven insights.
-
Slide Structure
Each slide contains a title input area (upper left, 1 field), descriptive text area (right, 1 field), central 3-layer stacked area chart (6 years: 2020–2025), and three circular icons with explanatory text (3 items), totaling four information layers.
Related Products
-

Management Performance Analysis Mixed Chart – Visualizing Strategies and Achievements
#Business Strategy #Market and Competitor Analysis #Graph
-

Area 3D Graph – Market and Competitor Analysis
#Market and Competitor Analysis #Graph #Other
-

Global Market Analysis Map – Importance of Market Connectivity
#Company Introduction #Market and Competitor Analysis #Graph
-

Bathroom Demand Survey Graph – Donut Chart for Market Analysis
#Market and Competitor Analysis #Graph #Other
