Market Analysis with Laptop Mockup and Segmental Graphs – Enhancing Customer Understanding
RJ0500027_27
- Last Update 06/14/2025
- File Size 2.5MB
- # of Slides 2
- File Format PPTX
- Slide Ratio 16:9
- Color
Keywords
- #Content-Based Slides
- #Design-Based Slides
- #Market and Competitor Analysis
- #Graph
- #Other
- #Customer Analysis
- #Column
- #Segmented Column
- #Mockup
- #16:9
- #laptop mockup PowerPoint slide
- #stacked column chart template
- #market analysis presentation
- #device mockup PPT download
- #customer segmentation slide
- #multi-series bar chart PowerPoint
About the Product
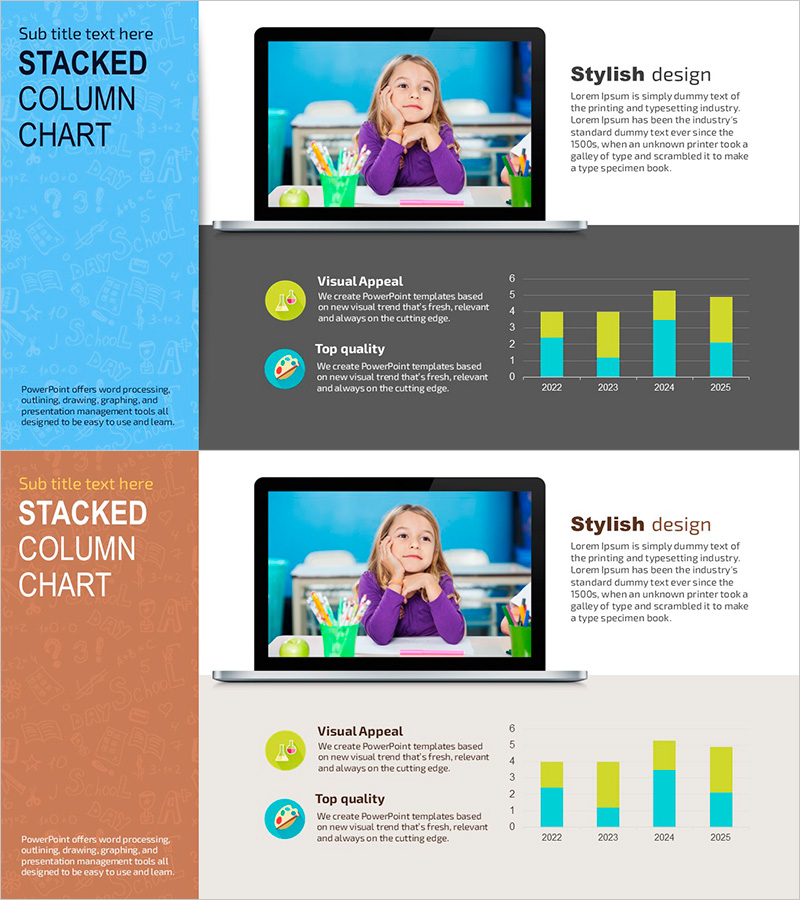
A professional PowerPoint slide set combining laptop screen mockup with stacked column chart for market analysis and customer segmentation. This 2-slide presentation template features an editable device mockup displaying content on a notebook screen, paired with a 4-series stacked bar chart showing year-over-year trends from 2022 to 2025. The blue and orange background tones contrast with yellow and cyan data series, making it ideal for business reports, marketing presentations, and investor pitches where customer insights and market breakdown are essential.
Usage Points
-
Main Usage
Display market data and customer insights on a laptop screen mockup to communicate segmentation analysis and business performance trends. The stacked column chart enables comparison of multiple data series across time periods, emphasizing key metrics and competitive positioning.
-
How to Use
Use slide 1 to introduce product or service features via the laptop mockup, then transition to slide 2 to present customer segment performance using the stacked column chart. Ideal for marketing strategy decks, quarterly business reviews, and investor presentations where data-driven storytelling is critical.
-
Recommended For
Marketing managers, business analysts, sales directors, and executives presenting customer analysis and market trends. Suitable for B2B proposals, quarterly earnings reports, product launch presentations, and strategic planning sessions requiring visual data representation.
-
Slide Structure
Slide 1: Laptop mockup (16:9 widescreen format) with editable screen content area and text placeholder / Slide 2: 4-series stacked column chart (4 years: 2022–2025) with legend and descriptive text. Blue and orange backgrounds with yellow and cyan data highlights ensure clarity and visual hierarchy.
Related Products
-

Medical Services Characteristics Connection Diagram
#Market and Competitor Analysis #Graph #Customer Analysis
-

Analyzing Chart Results by Item – Understanding the Market and Customers
#Market and Competitor Analysis #Graph #Other
-

Internet Theme Segmentation Bar Graph – Market Status Analysis
#Market and Competitor Analysis #Graph #Market Status
-

Change Trend According to Situation – Market Trends and Analysis
#Market and Competitor Analysis #Graph #Customer Analysis
