Animal Silhouette Graph – Market Analysis Template
RJ0500026_23
- Last Update 06/14/2025
- File Size 0.5MB
- # of Slides 2
- File Format PPTX
- Slide Ratio 16:9
- Color
Keywords
About the Product
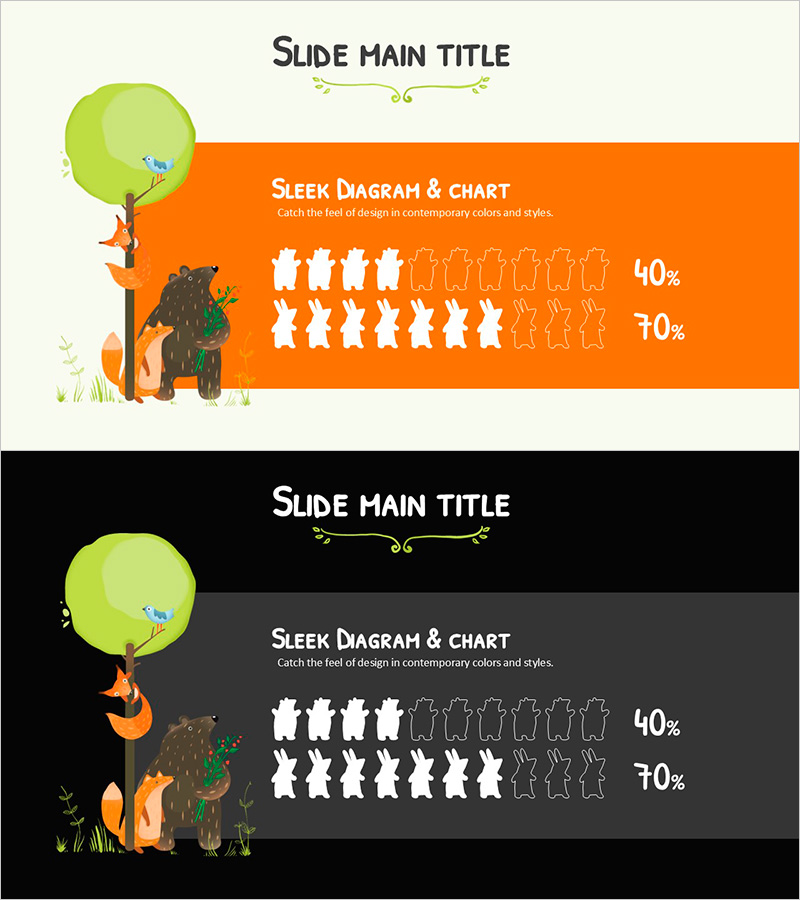
A PowerPoint slide featuring animal silhouette graphs designed for market analysis and data comparison. This 2-slide set uses a vibrant orange background with white animal silhouettes to visually represent numerical comparisons like 40% and 70%. The nature-inspired design with trees and animal illustrations creates an engaging visual narrative for presenting market share, customer distribution, and growth rates. Perfect for business presentations, planning documents, and analytical reports that require intuitive data visualization. Available in 16:9 widescreen PPTX format, fully editable and ready to customize with your own data.
Usage Points
-
Main Usage
Transform quantitative market data, competitive analysis, and customer distribution into compelling visual narratives using animal silhouette graphs. The orange background and silhouette design create immediate visual impact while clearly communicating percentage-based comparisons to your audience.
-
How to Use
Deploy this slide in market analysis, competitive positioning, and customer segmentation sections of your presentation. The bold orange background emphasizes critical data points, while animal silhouettes naturally draw audience attention to your key metrics and comparative insights.
-
Recommended For
Marketing strategy presentations, business analysis reports, investor pitch decks, and market research briefings. Ideal for startups, consulting firms, and marketing teams presenting competitive analysis, market share data, and customer demographic comparisons.
-
Slide Structure
Two-slide layout with title area, orange data visualization zone, and animal silhouette graph elements. White and outlined silhouette icons represent proportional data, with numerical input fields positioned on the right for optimal readability and easy data updates.
Related Products
-

Gender Ratio Customer Analysis 3D Circle Graph – Insights for Market Understanding
#Market and Competitor Analysis #Graph #Other
-

Silhouette Step Diagram – Effective Tool for Market Analysis
#Market and Competitor Analysis #Graph #Other
-

Comparative Chart of Male and Female Professionals
#Market and Competitor Analysis #Graph #Other
-

Analysis Graph by Job Field – Market and Competition Overview
#Market and Competitor Analysis #Graph #Other
