Market Analysis Using World Map of Animal Distribution
RJ0500026_21
- Last Update 06/14/2025
- File Size 1.3MB
- # of Slides 2
- File Format PPTX
- Slide Ratio 16:9
- Color
Keywords
About the Product
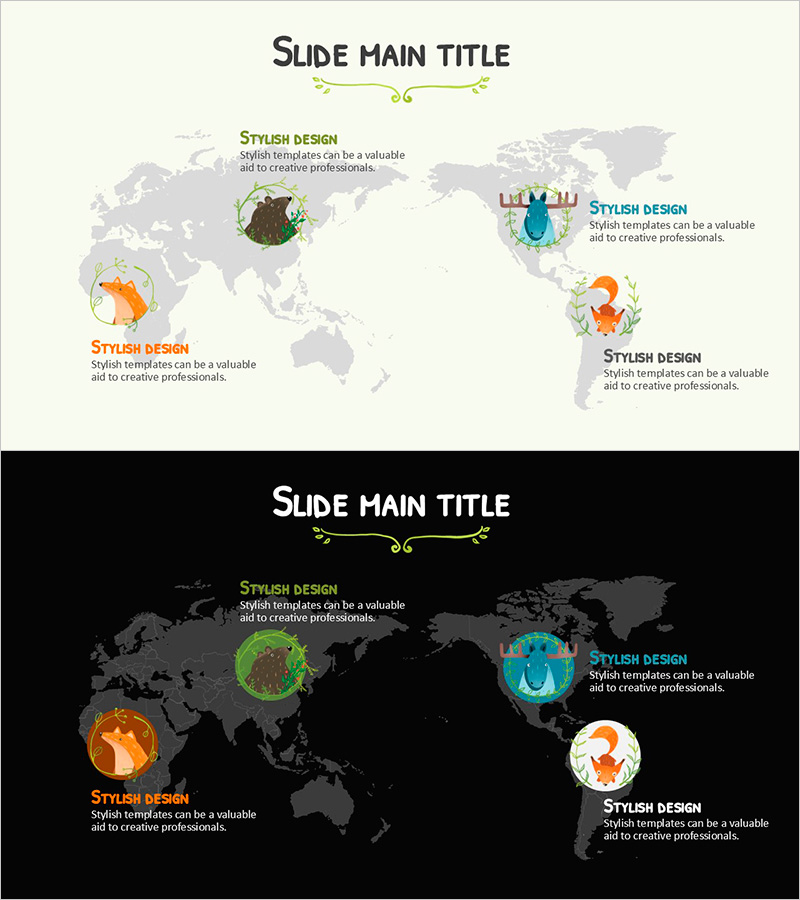
A PowerPoint slide that visualizes market characteristics across four major global regions using animal distribution icons on a world map. Available in two versions with light beige and dark black backgrounds, this presentation slide features a world map with four regional zones marked by circular icons. Each region includes dedicated title and description text areas, making it ideal for market analysis presentations, regional customer profiling, and global business strategy discussions. The 16:9 widescreen PPTX format allows immediate editing and full customization of colors, icons, and text content.
Usage Points
-
Main Usage
This slide effectively communicates global market analysis and regional characteristic comparisons through visual representation. By displaying four key regions on a world map with distinctive animal icons, you can intuitively explain differentiated market features. It's particularly valuable for investor presentations, business strategy development, and marketing planning phases where global market insights need clear visual communication.
-
How to Use
Input market names, customer characteristics, sales strategies, and growth potential into each of the four regional zones. Animal icons can be customized to symbolize industry-specific traits or brand identity for each region. The light background suits corporate presentations and seminars, while the dark background emphasizes premium brand image. Adjust text size and color to highlight key information points.
-
Recommended For
Ideal for executives developing global business strategies, international marketing managers, startup founders planning overseas market entry, sales teams presenting regional customer analysis, and companies preparing investment pitch decks. Particularly effective for multinational corporations' quarterly business reports and new market expansion strategy presentations.
-
Slide Structure
The slide features a title area at the top center, a world map background in the middle, and four regional information blocks positioned at top-left, top-right, bottom-left, and bottom-right. Each block contains a circular icon, region title, and three lines of description text area, providing a balanced comparative layout.
Related Products
-

Trends in Heavy Equipment Utilization – Market Analysis
#Business Introduction #Market and Competitor Analysis #Graph
-

Green Brown Area Chart – Market and Competitor Analysis
#Market and Competitor Analysis #Graph #Other
-

Market Analysis Infographic Slide on Depression – Understanding and Empathy
#Market and Competitor Analysis #Other #Market Analysis
-

Investment Distribution for Green Growth Slide
#Market and Competitor Analysis #Other #Market Analysis
