Research System and Area Chart – Visual Data Insights
RJ0500025_27
- Last Update 06/13/2025
- File Size 0.4MB
- # of Slides 2
- File Format PPTX
- Slide Ratio 16:9
- Color
Keywords
About the Product
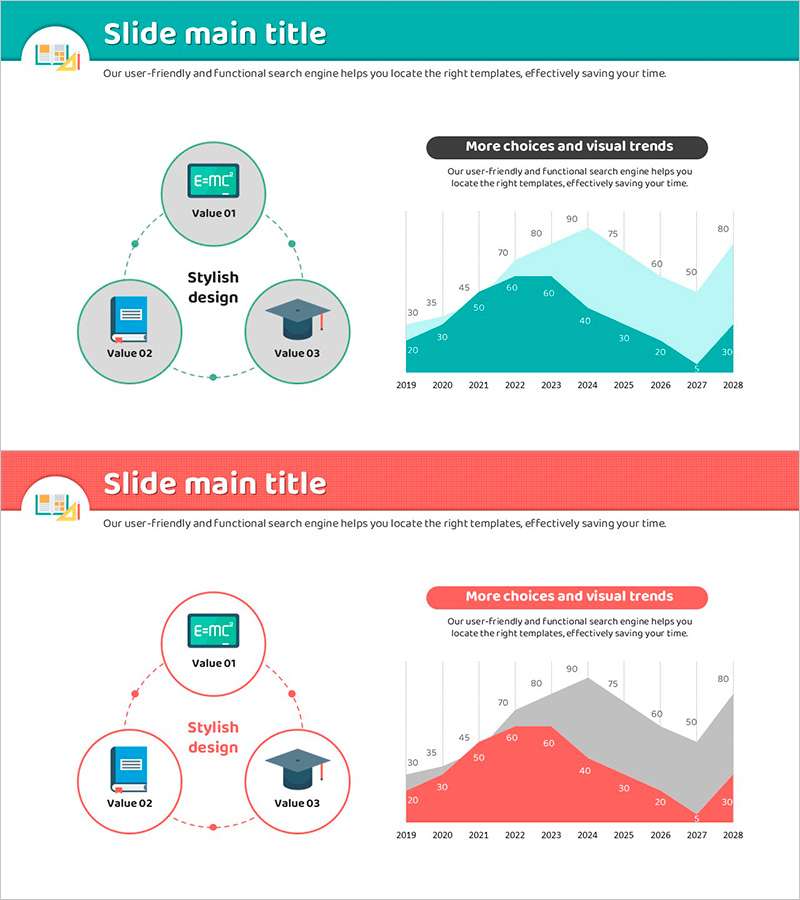
A professional area chart PowerPoint slide designed for research data and statistical analysis presentations. This 2-slide set visualizes three data series across a 10-year timeline (2019–2028) using stacked area format with teal and gray gradient fills to distinguish data layers clearly. The cumulative area representation makes it easy to compare individual trends while showing overall magnitude. Ideal for research reports, academic presentations, and data analysis decks. Delivered in 16:9 widescreen PPTX format with fully editable elements for seamless customization.
Usage Points
-
Main Usage
Visualize cumulative changes in multi-series time-series data using stacked area format, allowing simultaneous display of overall magnitude and individual series trends. Optimized for presenting research findings, market analysis, and financial data in academic and professional contexts.
-
How to Use
Insert into the data analysis section of research reports, results explanation slides in academic presentations, or trend comparison pages in statistical analysis decks. Customize legend labels and axis values to match your dataset and deploy immediately without additional design work.
-
Recommended For
Researchers, data analysts, statisticians, academic presenters, and market research professionals who need to communicate quantitative data persuasively. Suitable for thesis defenses, conference seminars, corporate analysis reports, and any scenario requiring credible multi-series data representation.
-
Slide Structure
Slide 1: Stacked area chart with 3 data series spanning 10 years (2019–2028). Slide 2: Same data rendered in grayscale gradient for print-friendly and color-blind accessible presentations. Both slides feature a title area and full-width chart area for easy customization.
Related Products
-

User Analysis Graph by Age Group – Advanced Data Insights
#Market and Competitor Analysis #Diagram #Graph
-

Green Red Interactive Bar Graph
#Market and Competitor Analysis #Graph #Competitive Advantage
-

Mobile App Service Development Status – Doughnut Chart Visualization
#Product/Service Introduction #Business Introduction #Graph
-

Spring Pastel Wide PowerPoint Template Vertical Bar Chart
#Market and Competitor Analysis #Graph #Industry Trends
