Green Red Interactive Bar Graph
RJ0300028_25
- Last Update 04/25/2025
- File Size 2.1MB
- # of Slides 2
- File Format PPTX
- Slide Ratio 16:9
- Color
Keywords
- #Content-Based Slides
- #Design-Based Slides
- #Market and Competitor Analysis
- #Graph
- #Competitive Advantage
- #Horizontal Bar
- #Double Horizontal Bar
- #16:9
- #bidirectional bar chart
- #two-way horizontal bar graph PowerPoint
- #comparative analysis slide
- #competitive advantage visualization
- #5-item comparison chart
About the Product
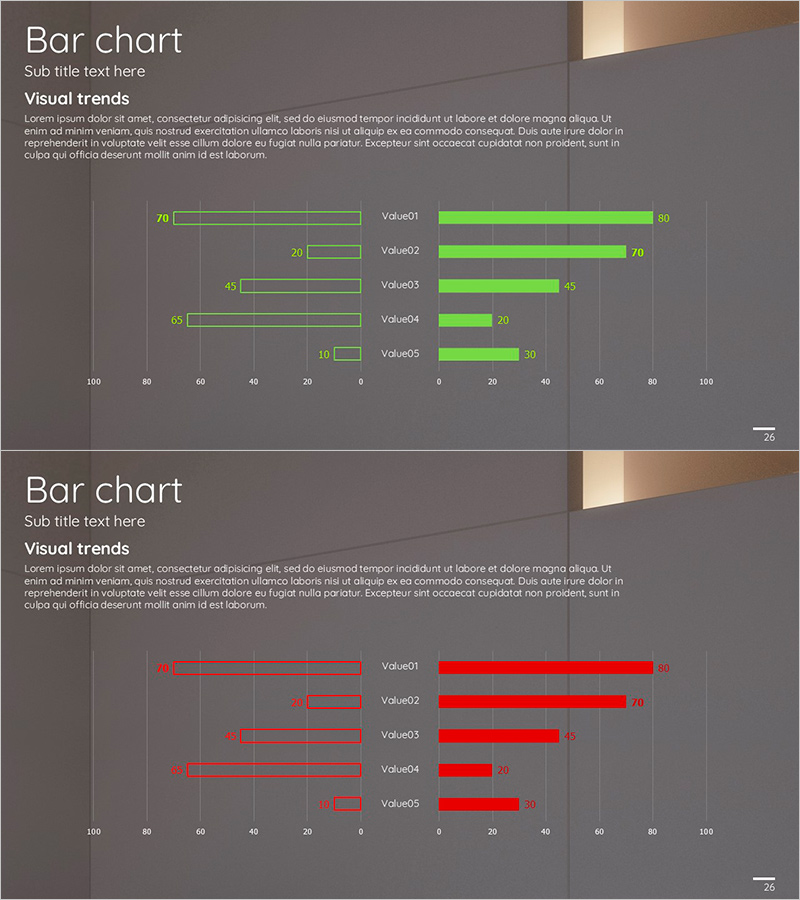
A horizontal bar chart PowerPoint slide that compares five data items using green and red colors in opposite directions. The symmetric layout with a left negative axis and right positive axis makes it ideal for competitive analysis, pros-and-cons evaluation, and market share comparison. Each bar displays numerical labels for precise data communication, while the dark gray background with bright color contrast maximizes presentation impact. The 2-slide 16:9 format is ready to edit and use immediately.
Usage Points
-
Main Usage
Designed to compare two opposing data series simultaneously. Ideal for competitive performance benchmarking, strength-weakness analysis, market share comparison, budget versus actual results, and goal versus achievement tracking.
-
How to Use
Enter data on the left negative axis (green) and right positive axis (red) for automatic symmetric layout. Double-click numerical labels to update with actual data, and adjust colors to match your corporate brand. Two slides allow multiple comparison scenarios.
-
Recommended For
Executive reports, strategy meetings, marketing analysis presentations, investor pitch decks, and consulting proposals where competitive advantage and market analysis need emphasis. Suitable for financial analysis, performance reviews, and market research presentations.
-
Slide Structure
Each slide features 5 horizontal bars arranged symmetrically around a center zero axis. Green bars extend left, red bars extend right, with numerical labels displayed on each bar. Item names are positioned on the left side of the center axis. Dark gray background with bright color contrast emphasizes data impact.
Related Products
-

Sales Comparison Graph by Product – Competitive Advantage and Performance Analysis
#Market and Competitor Analysis #Financial Plans and Performance #Graph
-

Company Two-Way Horizontal Bar Graph – Competitive Advantage Analysis
#Market and Competitor Analysis #Graph #Market Status
-

Simple Circle Presentation Template Bilateral Bar Graph
#Market and Competitor Analysis #Graph #Competitive Advantage
-

Business Competitor Analysis Graph
#Market and Competitor Analysis #Graph #Competitor Analysis
