Academic Specific Gauge Closure Diagram – Streamlining Marketing Strategies
RJ0500025_14
- Last Update 06/13/2025
- File Size 0.4MB
- # of Slides 2
- File Format PPTX
- Slide Ratio 16:9
- Color
Keywords
- #Content-Based Slides
- #Design-Based Slides
- #Marketing Plan and Strategy
- #Diagram
- #Graph
- #Other
- #Marketing Objectives
- #Key Marketing Activities
- #Cluster
- #Closed Cluster Diagram
- #16:9
- #radial gauge diagram PowerPoint
- #closure diagram slide template
- #4-stage circular gauge
- #marketing strategy diagram
- #goal achievement rate PPT
About the Product
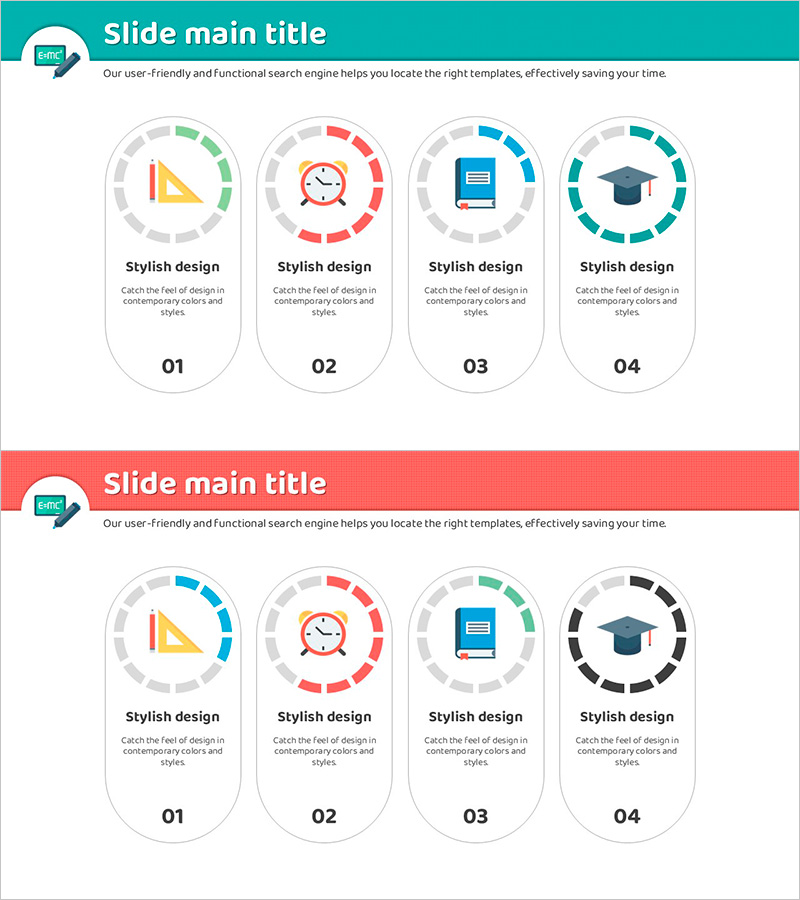
A 4-stage radial gauge closure diagram PowerPoint slide designed to visualize marketing strategies, business objectives, and performance metrics. The circular gauge structure in turquoise and red dual-tone colors enables clear representation of progress rates, achievement levels, and priorities at each stage. Provided in a 2-slide set with identical layout variations, allowing flexible editing of icons, text, and data for immediate use in strategy presentations, marketing planning, and project management briefings.
Usage Points
-
Main Usage
Visualize marketing strategies, business objectives, performance evaluation, and priority management through a circular gauge structure to clearly communicate organizational goals and progress. Each stage's achievement rate, importance level, and progress status can be understood at a glance.
-
How to Use
Use in executive briefings, strategy planning meetings, marketing presentation sessions, and project kickoff meetings to explain organizational goals, strategies, and execution plans stage by stage. Customize gauge text, icons, and colors to match your organization's strategic items for tailored presentation materials.
-
Recommended For
Recommended for marketing professionals, strategy planning teams, executives, project managers, and organizational development specialists who need to visually communicate goal achievement rates, strategy progress, and performance evaluation. Particularly effective for expressing multiple objectives, multi-stage processes, and priority management.
-
Slide Structure
2-slide set featuring identical 4-stage radial gauge layouts. Each slide displays four circular gauges arranged radially around a central icon, with turquoise, red, and gray-tone segments representing progress. Text areas below each gauge allow input of item names, numerical values, and descriptions.
Related Products
-

Performance Measurement and Analysis Strategy – Effectiveness Analysis Plans
#Business Management #Operational Plan #Diagram
-

Mobile Global Service Differentiation Strategy Slide
#Product/Service Introduction #Marketing Plan and Strategy #Diagram
-

Space Industry Positioning Diagram – Market Analysis and Strategy
#Market and Competitor Analysis #Marketing Plan and Strategy #Diagram
-

Competitor Benchmarking & Positioning Map Slide
#Product/Service Introduction #Technical Approach #Diagram
