Visualization of Day and Night Shooting Information – Contemporary Design
RJ0500021_17
- Last Update 06/12/2025
- File Size 0.3MB
- # of Slides 2
- File Format PPTX
- Slide Ratio 16:9
- Color
Keywords
- #Content-Based Slides
- #Design-Based Slides
- #Product/Service Introduction
- #Diagram
- #Development Status
- #Cluster
- #Table
- #Chain Diagram
- #16:9
- #time-based diagram PowerPoint
- #connected information visualization slide
- #day and night comparison template
- #timeline diagram presentation
- #shooting data analysis PPT
About the Product
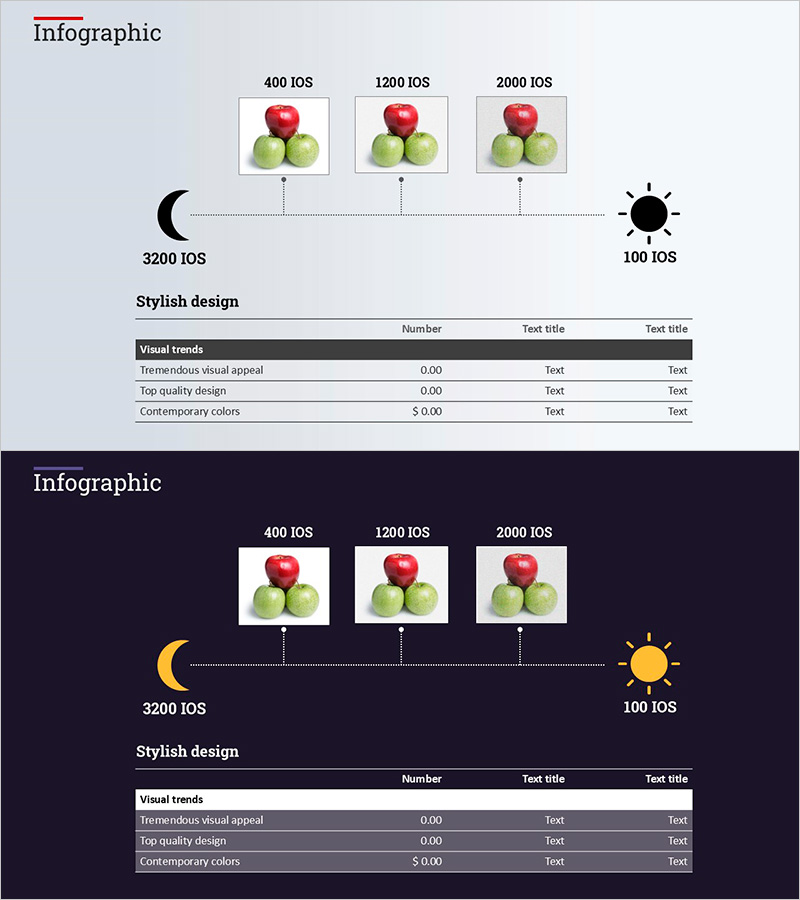
A horizontal timeline diagram PowerPoint slide comparing day and night shooting data with visual clarity. The design features a moon icon (3200 IOS) on the left connected to a sun icon (100 IOS) on the right, with three shooting sample images (400 IOS, 1200 IOS, 2000 IOS) positioned vertically along the timeline. A comparison table below displays visual trends data (tremendous visual appeal, top quality design, contemporary colors) with numerical values and text fields for detailed analysis. The light background contrasts with the dark table for enhanced readability. Two-slide set includes both light and dark theme versions for flexible presentation design. Delivered in 16:9 widescreen PPTX format, fully editable for immediate customization.
Usage Points
-
Main Usage
Compare shooting conditions across time periods, analyze day versus night performance data, visualize temporal changes in image quality, and present information analysis in professional presentations. The connected diagram structure simultaneously expresses time progression and data relationships, enhancing audience comprehension.
-
How to Use
Apply to marketing analysis presentations, product development reports, photography technique seminars, and data analysis meetings requiring time-based performance comparison sections. Replace sample images with actual project photos and update table values with your data to create customized presentation materials.
-
Recommended For
Video production teams, photography professionals, marketing managers, technical development teams, data analysts, and educators presenting time-based performance comparisons and information analysis. Particularly effective for shooting condition analysis, product performance benchmarking, and temporal trend visualization content.
-
Slide Structure
Slide 1 (light theme): Horizontal timeline from left moon icon through three centered image boxes to right sun icon. Bottom section contains 3×3 data table with visual trends metrics and editable value fields. Slide 2 (dark theme): Identical structure with inverted background colors. All text areas and numerical input fields are fully editable.
Related Products
-

Aviation Service Development Schedule Donut Circle Graph
#Product/Service Introduction #Market and Competitor Analysis #Diagram
-

Map of Korean Market Development Status
#Product/Service Introduction #Marketing Plan and Strategy #Diagram
-

Work Progress Status Graph – Visualizing Current Project Status
#Product/Service Introduction #Operational Plan #Diagram
-

Gardening System - Effective Service Operation Diagram
#Technical Approach #Diagram #Service Operation Plan
