Global Business Areas Diagram – Business Visualization
RM0500005_5
- Last Update 02/21/2025
- File Size 0.3MB
- # of Slides 2
- File Format PPTX
- Slide Ratio 16:9
- Color
Keywords
- #Content-Based Slides
- #Design-Based Slides
- #Product/Service Introduction
- #Business Introduction
- #Diagram
- #Development Status
- #Business Areas
- #Cluster
- #Spread
- #Chain Diagram
- #Centralized Diagram
- #16:9
- #radial diagram PowerPoint
- #global business areas slide
- #hub and spoke diagram
- #business visualization PPT
- #organizational structure PowerPoint
About the Product
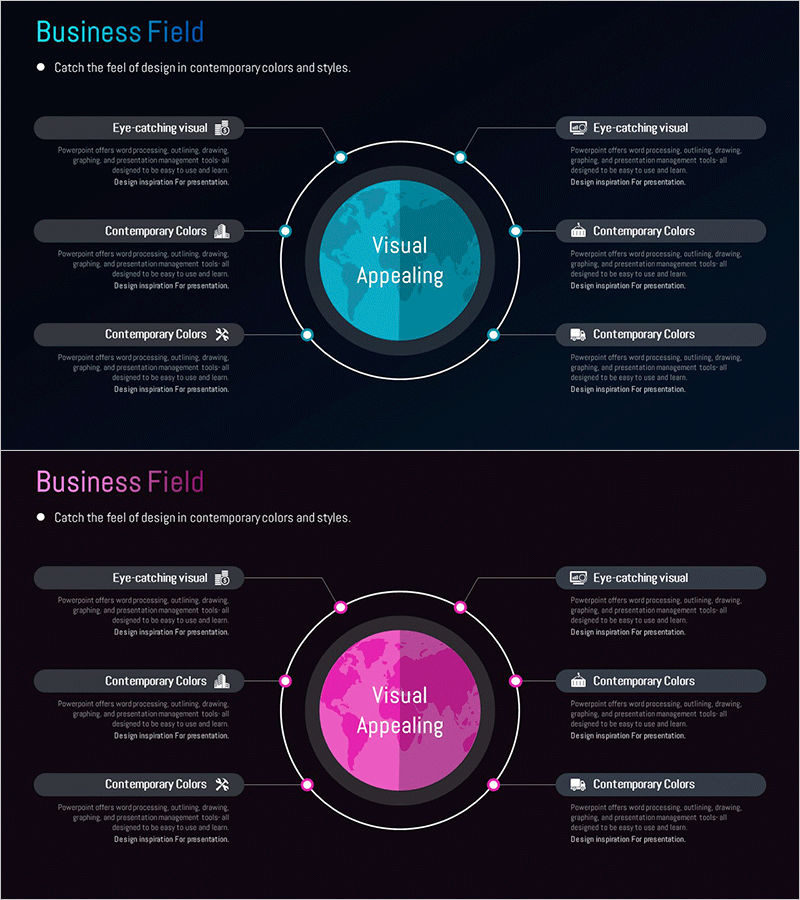
A radial diagram PowerPoint slide with a central hub expanding to six directional nodes, ideal for visualizing global business areas and organizational structure. The dark background features cyan and magenta gradient circular nodes arranged in a 360-degree pattern, each with icons and text labels. The design clearly expresses hierarchical relationships from the central concept to surrounding elements. Two slide variations provide both cyan and magenta color schemes to match your presentation theme. Delivered in 16:9 widescreen PPTX format, fully editable and ready to customize with your business data.
Usage Points
-
Main Usage
Effectively communicate multi-layered structures where a central concept radiates to surrounding elements. The radial layout emphasizes equal importance of all nodes while clearly showing relationships and influence flowing from the central hub to peripheral components.
-
How to Use
Insert this slide into company overview, business strategy, or organizational structure presentations. Edit the node text and icons to reflect your actual business divisions, departments, or core values. The template is fully editable in PowerPoint, allowing you to customize colors, text, and icons to match your corporate branding.
-
Recommended For
Executives, business development managers, marketing professionals, consultants, and investment pitch presenters explaining global business portfolios, organizational diversification, and strategic business units. Ideal for international business presentations, multinational corporation overviews, and business expansion strategies.
-
Slide Structure
Central circular node (cyan or magenta gradient) surrounded by six equally-sized nodes positioned at 360-degree intervals. Each node includes an icon, text label, and connecting lines. Dark background provides contrast with bright node colors. Two slide variations offer color flexibility.
Related Products
-

Business Activity Areas Diagram – Visual Design for Business Success
#Company Introduction #Business Introduction #Diagram
-

Science Experimental Area Diffusion Diagram – Connecting Innovative Ideas
#Business Introduction #Diagram #Business Areas
-

Mobile Financial Services Business Area Slide
#Company Introduction #Business Introduction #Diagram
-

Circular Puzzle Diagram – Infographic for Business Introduction
#Company Introduction #Business Introduction #Diagram
