Business Process Diagram – Optimizing Workflow
RJ0300041_17
- Last Update 04/28/2025
- File Size 1.2MB
- # of Slides 2
- File Format PPTX
- Slide Ratio 16:9
- Color
Keywords
- #Content-Based Slides
- #Design-Based Slides
- #Business Strategy
- #Operational Plan
- #Diagram
- #Step-by-Step Schedule Plan
- #Business Processes
- #Flow
- #Cluster
- #Table
- #Chain Diagram
- #16:9
- #4-step process diagram
- #linear workflow PowerPoint slide
- #business process diagram template
- #connected flow chart
- #process flow PPT slide
About the Product
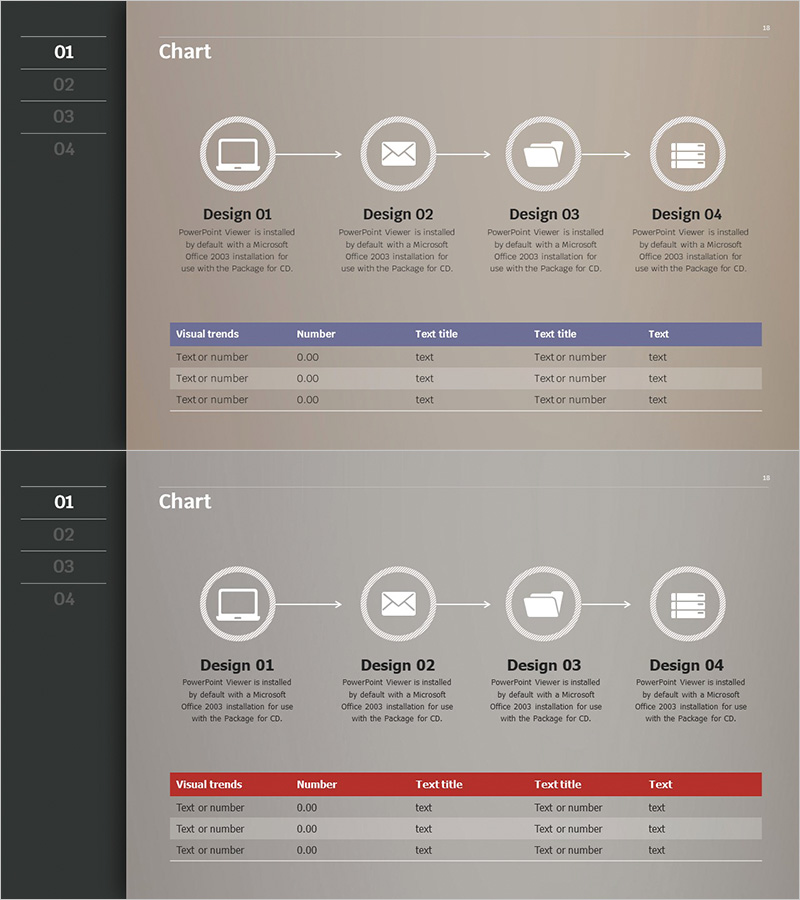
A 4-step linear process diagram PowerPoint slide designed to visualize business workflows and sequential operations. The diagram features circular nodes connected by directional arrows, creating an intuitive flow structure that clearly represents each stage of a business process. Set against a beige background with white circular icons and black typography, the layout maintains professional clarity and readability. Each node includes a text description area below for detailed explanations, and a data table section at the bottom enables additional information organization. The 2-slide set provides two color theme variations (blue and red headers) allowing you to select the version that best matches your presentation context.
Usage Points
-
Main Usage
Ideal for explaining business processes, operational workflows, and stage-by-stage progress in a visual format. Effectively communicates product development phases, sales pipelines, service delivery procedures, and other sequential workflows by structuring them into four clear stages, enhancing audience comprehension.
-
How to Use
Enter stage names in each circular node and add detailed descriptions in the text areas below. Use the table section to organize numerical data or supplementary information that emphasizes process efficiency. Customize the color theme to align with your brand identity and presentation style.
-
Recommended For
Ideal for executives, project managers, consultants, and marketing professionals presenting process improvements, system implementation plans, and service optimization strategies. Suitable for executive meetings, client proposals, and internal training materials.
-
Slide Structure
Slide 1: Beige background with 4 circular nodes connected by directional arrows in linear arrangement. Text input areas positioned below each node. Bottom section contains a 5-column data table (Visual trends·Number·Test title·Test title·Text). Slide 2: Identical structure with blue header table. 16:9 aspect ratio, PPTX format.
Related Products
-

Visualizing Daily Work Processes – Effective Operational Planning
#Business Strategy #Operational Plan #Diagram
-

Idea Meeting Process - Multidirectional Flow Diagram
#Business Strategy #Operational Plan #Diagram
-

Business Process Steps – Efficient Operational Strategy
#Business Strategy #Operational Plan #Diagram
-

Procedures for Applying for a Move-in of a Silver Town – Step-by-Step Flow Description
#Business Strategy #Operational Plan #Diagram
