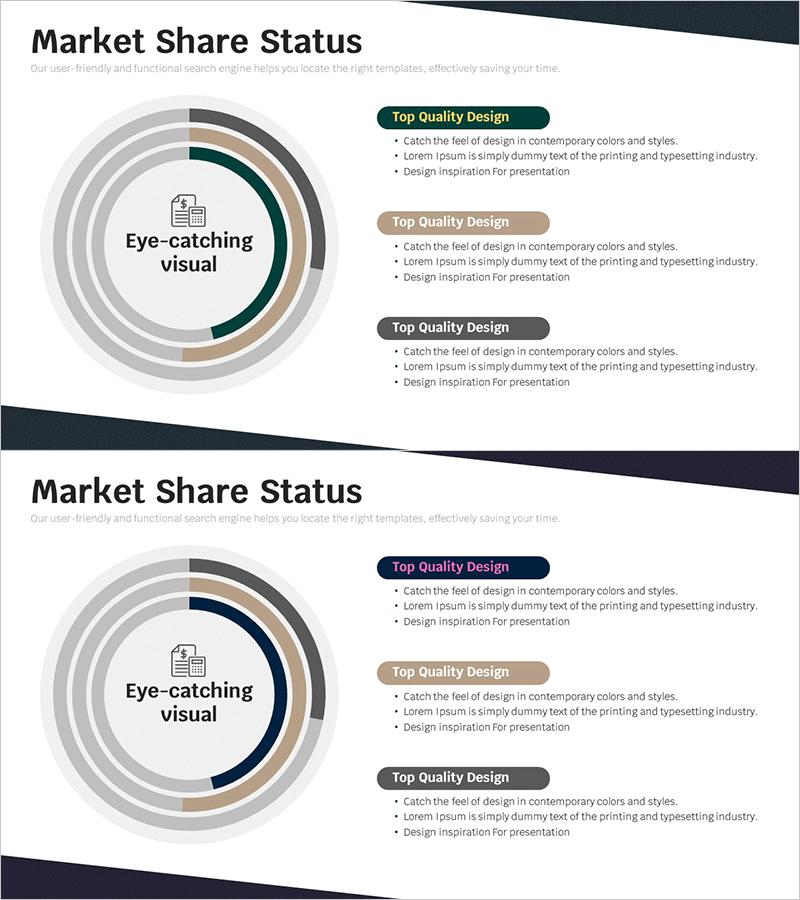
Circle Donut Market Share Graph – Visual Elements for Market Analysis
RM0100014_11
- Last Update 01/29/2025
- File Size 0.3MB
- # of Slides 2
- File Format PPTX
- Slide Ratio 16:9
- Color
Keywords
About the Product
A donut chart PowerPoint slide optimized for market analysis presentations. This 3-segment circular graph allows you to display competitive market share data with a central icon and text area, creating an intuitive visual hierarchy. The multi-layer ring structure uses dark teal, beige, and gray tones to clearly differentiate data layers, making it ideal for business reports, investor pitches, and market analysis documents. The 2-slide set accommodates various market scenarios, and the 16:9 widescreen format ensures compatibility with modern projectors and displays.
Usage Points
-
Main Usage
This slide is designed to present market share data in market analysis and competitive positioning sections. The central area accommodates company logos or key messages, while the three ring layers display market share percentages for competing companies or market segments, providing an at-a-glance view of market dynamics.
-
How to Use
Use this slide in the market analysis section of business plans, investor presentations, or marketing strategy documents. Adjust ring colors and sizes to match your data, replace the center icon with your company logo, and input percentages and labels. The 2-slide format allows you to compare current market conditions with target market share projections.
-
Recommended For
Ideal for marketing, sales, and executive presentations. Particularly effective when presenting market entry strategies, competitive analysis, or business performance reports where market share changes need compelling visual communication. Commonly used in consulting reports, strategic plans, and quarterly business reviews.
-
Slide Structure
Concentric ring donut chart with 3 data layers. The innermost center area contains space for icons, logos, or text. Three surrounding rings in distinct colors (dark teal, beige, gray) represent data segments with arc divisions for percentage display. A legend and description area is positioned to the right for additional context and data labels.
Related Products
-

Purple Brown Competitive Advantage Donut Graph – Visualizing Market Share
#Market and Competitor Analysis #Graph #Market Share
-

Graph of Environmental Pollution – Market Share Analysis
#Market and Competitor Analysis #Graph #Market Share
-

Green Red Donut Chart – Market Share Analysis
#Market and Competitor Analysis #Graph #Market Share
-

Animals Nature Donut Chart Infographics – Market Share Analysis
#Market and Competitor Analysis #Graph #Market Share
