Button Image and Line Graph – Displaying Competitive Advantage
RJ0500019_5
- Last Update 06/12/2025
- File Size 1MB
- # of Slides 2
- File Format PPTX
- Slide Ratio 16:9
- Color
Keywords
About the Product
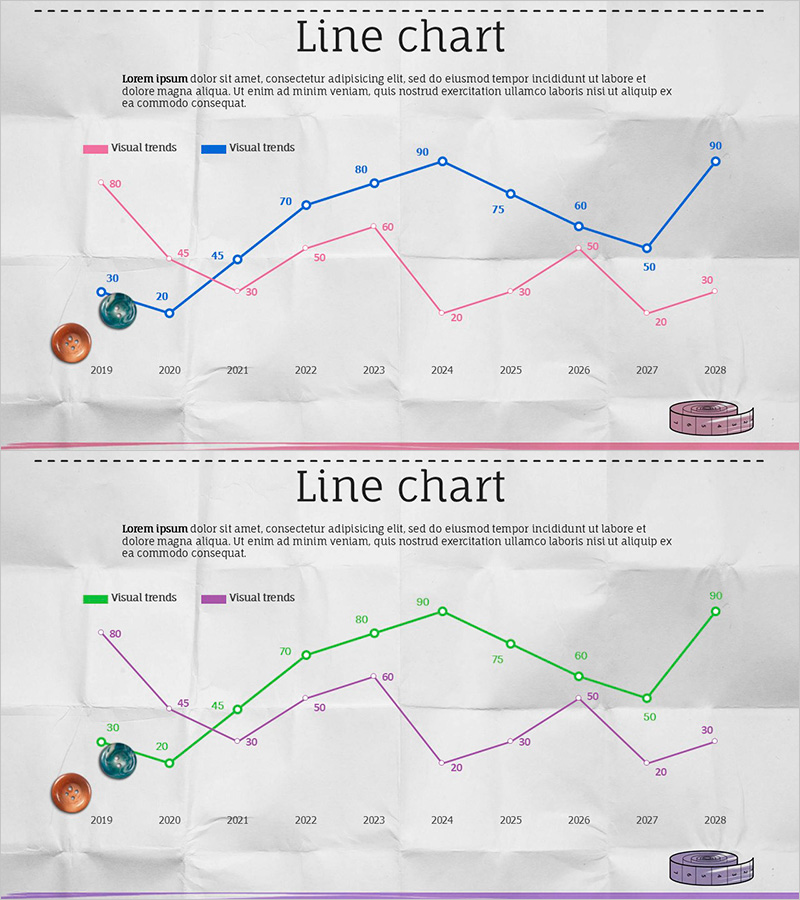
A PowerPoint line chart slide comparing two data series across a 10-year timeline from 2019 to 2028. Features dual color schemes—pink and blue, or green and purple—with clearly labeled data points ranging from 30 to 90 on each series. Decorative elements include a globe and coin icon on the left side, emphasizing global business context, and a database icon on the right, symbolizing data-driven decision-making. Provided in 2-slide format with color variations to match your presentation theme and brand guidelines. Fully editable PPTX format for immediate customization.
Usage Points
-
Main Usage
Ideal for comparing two key metrics over time—such as market competition, sales trends, or performance indicators. The 10-year timeline effectively demonstrates business growth and competitive positioning with objective, data-backed evidence.
-
How to Use
Use in business plans, investor pitch decks, quarterly earnings reports, and marketing strategy presentations to illustrate competitive advantage or market share evolution. Simply click on data points and replace with your actual figures for immediate presentation-ready results.
-
Recommended For
Executives, marketing managers, financial analysts, consultants, and sales leaders presenting business performance, market trends, or customer satisfaction metrics to senior management or investors.
-
Slide Structure
Two data series (Visual trends 1 and 2) plotted across 10 time points (2019–2028) with numeric labels at each point. Left side features decorative globe and coin icons; right side includes database icon. Legend clearly distinguishes between series. Two-slide format provides color variations (pink-blue and green-purple options).
Related Products
-

Accumulated Line Chart – Market and Competitor Analysis
#Market and Competitor Analysis #Financial Plans and Performance #Graph
-

Learning Goal Deflection Line Graph – Business Strategy
#Business Strategy #Market and Competitor Analysis #Graph
-

Vegetable Market Status Analysis with Line Charts
#Market and Competitor Analysis #Graph #Market Status
-

Social Network Wide Template Line Chart - Market Competition Analysis
#Business Strategy #Market and Competitor Analysis #Graph
