Visualizing Academic Status with Triple Donut Chart
RJ0500017_8
- Last Update 06/11/2025
- File Size 2MB
- # of Slides 2
- File Format PPTX
- Slide Ratio 16:9
- Color
Keywords
- #Content-Based Slides
- #Design-Based Slides
- #Product/Service Introduction
- #Market and Competitor Analysis
- #Graph
- #Development Status
- #Market Share
- #Circles
- #Doughnut Chart
- #16:9
- #donut chart PowerPoint
- #three-segment pie chart slide
- #ratio visualization template
- #academic status chart
- #donut graph presentation
About the Product
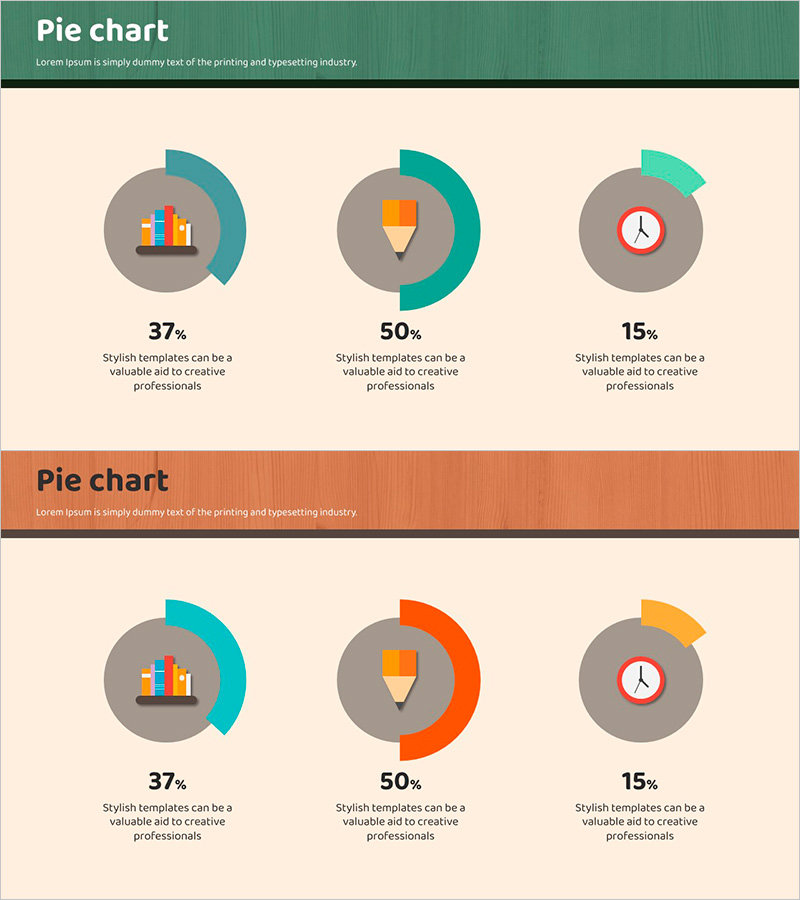
A PowerPoint slide that visualizes academic status using a three-layer donut chart design. The composition features a gray background circle with teal, orange, and lime-green segments layered concentrically, each paired with an academic icon (book, pencil, clock) to represent different categories. The 37%, 50%, and 15% data ratios are instantly comparable, making this slide template ideal for presentations, reports, and educational materials. Includes 2 slides in 16:9 widescreen format, delivered as PPTX file.
Usage Points
-
Main Usage
Visualizes ratio data for three academic metrics—such as learning progress, achievement rates, or subject completion—using a concentric donut chart. Icons embedded in each segment (book, pencil, clock) provide intuitive category identification, while the teal-orange-lime color scheme ensures clear data differentiation.
-
How to Use
Ideal for educational institutions, training centers, and universities presenting student performance distribution, learning goal achievement rates, or course completion statistics. Corporate training departments use it to report employee competency assessments and training completion rates. Also effective for academic seminars and thesis presentations when explaining research result proportions.
-
Recommended For
Education administrators, school officials, training center managers, student performance evaluators, university admissions coordinators, corporate talent development teams, education consultants, academic presenters, and education statisticians.
-
Slide Structure
Two-slide set: Slide 1 emphasizes the teal segment (37% academic icon), Slide 2 highlights orange and lime-green segments (50% pencil icon, 15% clock icon). Both slides feature a gray background circle with three concentric donut layers. Text areas below each chart allow for custom descriptions or data labels.
Related Products
-

Website Technology Development Status Graph – Market Share and Trends
#Product/Service Introduction #Market and Competitor Analysis #Graph
-

Analysis of Transportation Usage Status – Pie Chart
#Product/Service Introduction #Market and Competitor Analysis #Graph
-

Graph of Analysis of Transportation Development Status
#Product/Service Introduction #Market and Competitor Analysis #Graph
-

Analysis graph of market share progress
#Product/Service Introduction #Market and Competitor Analysis #Graph
