Orange Teal Donut Chart – Visualizing Financial Performance
RJ0500016_5
- Last Update 06/11/2025
- File Size 0.2MB
- # of Slides 2
- File Format PPTX
- Slide Ratio 16:9
- Color
Keywords
- #Content-Based Slides
- #Design-Based Slides
- #Financial Plans and Performance
- #Graph
- #Projected Return on Investment (ROI)
- #Budget
- #Circles
- #Doughnut Chart
- #16:9
- #donut chart PowerPoint
- #pie chart slide template
- #ratio visualization
- #financial performance chart
- #how to create donut chart in PowerPoint
About the Product
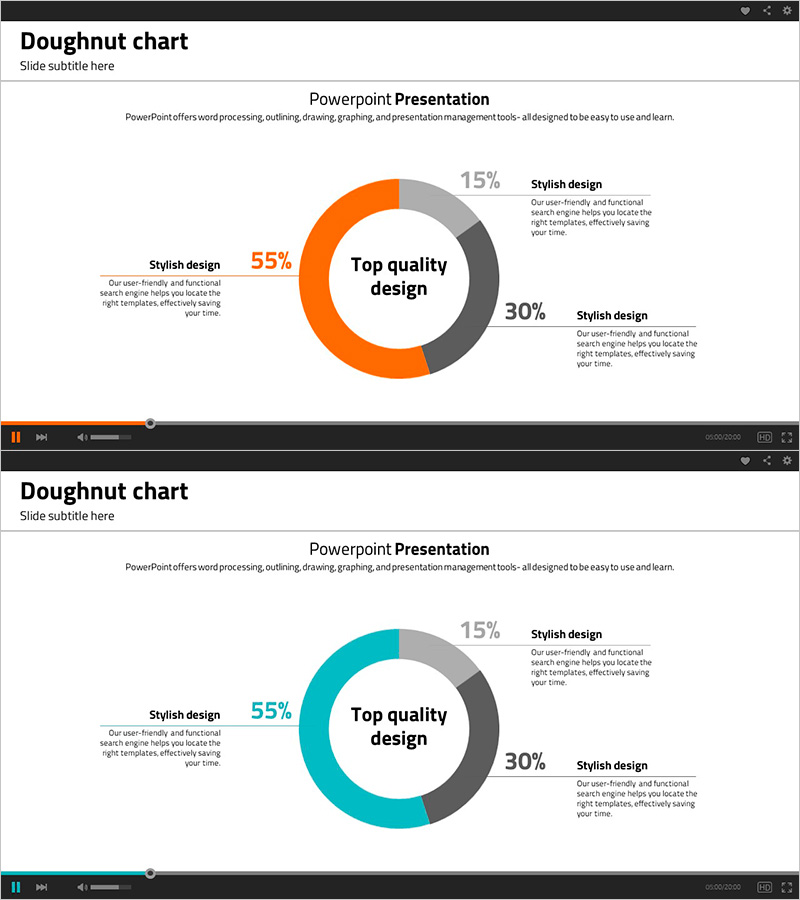
A donut chart PowerPoint slide designed to visualize financial performance and return on investment metrics. The chart features three color segments—orange (55%), teal (15%), and gray (30%)—with a central area for key messaging. The 2-slide set includes identical donut structures in varying color combinations, enabling comparison of multiple data points. Optimized for 16:9 widescreen format in PPTX, ready for immediate use in presentations and reports.
Usage Points
-
Main Usage
Displays proportional data such as financial performance, ROI, budget allocation, and market share using a donut chart format. The central messaging area emphasizes key metrics or titles, while the three colored segments instantly communicate composition ratios to your audience.
-
How to Use
Ideal for financial reports, business performance presentations, investor briefings, and quarterly results analysis. Modify segment percentages and legend text to represent your specific data. Add explanatory text in left and right text zones to provide context and clarity for each segment.
-
Recommended For
Finance teams, executives, business development, and marketing professionals presenting performance indicators and proportional data. Recommended for quarterly earnings reports, budget status updates, market analysis presentations, and any quantitative data visualization needs.
-
Slide Structure
2-slide layout. Each slide contains a central donut chart (3 segments), left text area (55% segment description), and right-side text zones (top, middle, bottom for 15% and 30% segment descriptions). Central donut area includes editable text field for key messaging.
Related Products
-

Marketing Budget Analysis Table & Donut Chart
#Financial Plans and Performance #Diagram #Graph
-

In-Depth Analysis Based on 70% Donut Chart – Insightful Market Share Insights
#Market and Competitor Analysis #Financial Plans and Performance #Graph
-

Arctic Business Expected Return on Investment Donut Chart
#Business Strategy #Financial Plans and Performance #Graph
-

Orange Yellow Chart Analysis – Utilizing Diagrams and Graphs
#Market and Competitor Analysis #Financial Plans and Performance #Diagram
