Marketing Budget Analysis Table & Donut Chart
RM0400007_26
- Last Update 02/16/2025
- File Size 0.4MB
- # of Slides 2
- File Format PPTX
- Slide Ratio 16:9
- Color
Keywords
- #Content-Based Slides
- #Design-Based Slides
- #Financial Plans and Performance
- #Diagram
- #Graph
- #Projected Return on Investment (ROI)
- #Budget
- #Table
- #Circles
- #Doughnut Chart
- #16:9
- #donut chart PowerPoint slide
- #pie chart presentation template
- #marketing budget analysis
- #budget allocation visualization
- #financial data PowerPoint
About the Product
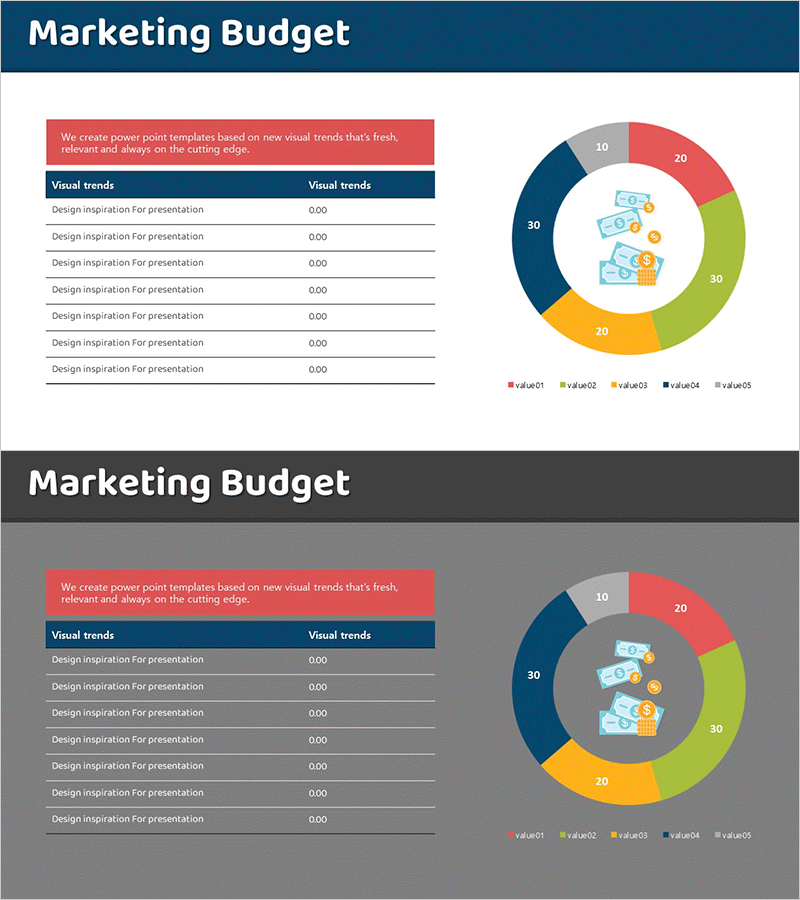
A PowerPoint slide featuring a 5-segment donut chart for visualizing marketing budget allocation. The design combines a detailed data table on the left with a color-coded donut chart on the right, using red, green, yellow, blue, and gray segments. A central icon emphasizes the budget theme. The table displays line items and corresponding values, while the donut chart shows proportional distribution at a glance. Ideal for financial planning presentations, ROI analysis, and budget status reports that require both detailed data and visual summary.
Usage Points
-
Main Usage
Presents marketing budget allocation across five categories using a donut chart, with a corresponding data table showing detailed line items and figures. Serves as a financial planning tool for budget reviews, ROI analysis, and executive-level budget status presentations.
-
How to Use
Deploy in marketing department budget review meetings, executive financial briefings, and investor relations presentations. Replace table entries and values with actual budget data, and adjust chart colors to match corporate branding for immediate use.
-
Recommended For
Marketing managers, financial analysts, executives, and investor relations professionals presenting budget allocation and financial performance. Best suited for scenarios requiring comparison of five or more budget categories with both detailed figures and proportional visualization.
-
Slide Structure
Slide 1: Dark blue header with title + red description box + 7-row, 2-column data table (dark blue header, item names and values) + 5-segment donut chart with central icon. Slide 2: Identical layout with dark gray background and white text for alternative color scheme.
Related Products
-

Estimated Fund Requirements for Construction Projects – Clear Financial Planning
#Financial Plans and Performance #Diagram #Projected Return on Investment (ROI)
-

Orange Teal Donut Chart – Visualizing Financial Performance
#Financial Plans and Performance #Graph #Projected Return on Investment (ROI)
-

Business Budget Summary Table – Visualizing Financial Plans and Performance
#Financial Plans and Performance #Diagram #Projected Return on Investment (ROI)
-

Expected Return on Investment Chart – Visualizing Financial Performance
#Financial Plans and Performance #Diagram #Projected Return on Investment (ROI)
