Arctic Business Expected Return on Investment Donut Chart
RJ0600040_8
- Last Update 07/01/2025
- File Size 0.5MB
- # of Slides 2
- File Format PPTX
- Slide Ratio 16:9
- Color
Keywords
- #Content-Based Slides
- #Design-Based Slides
- #Business Strategy
- #Financial Plans and Performance
- #Graph
- #Achievements
- #Projected Return on Investment (ROI)
- #Circles
- #Doughnut Chart
- #16:9
- #donut chart PowerPoint
- #pie chart slide template
- #ratio visualization
- #ROI chart
- #financial data presentation
- #donut graph slide download
About the Product
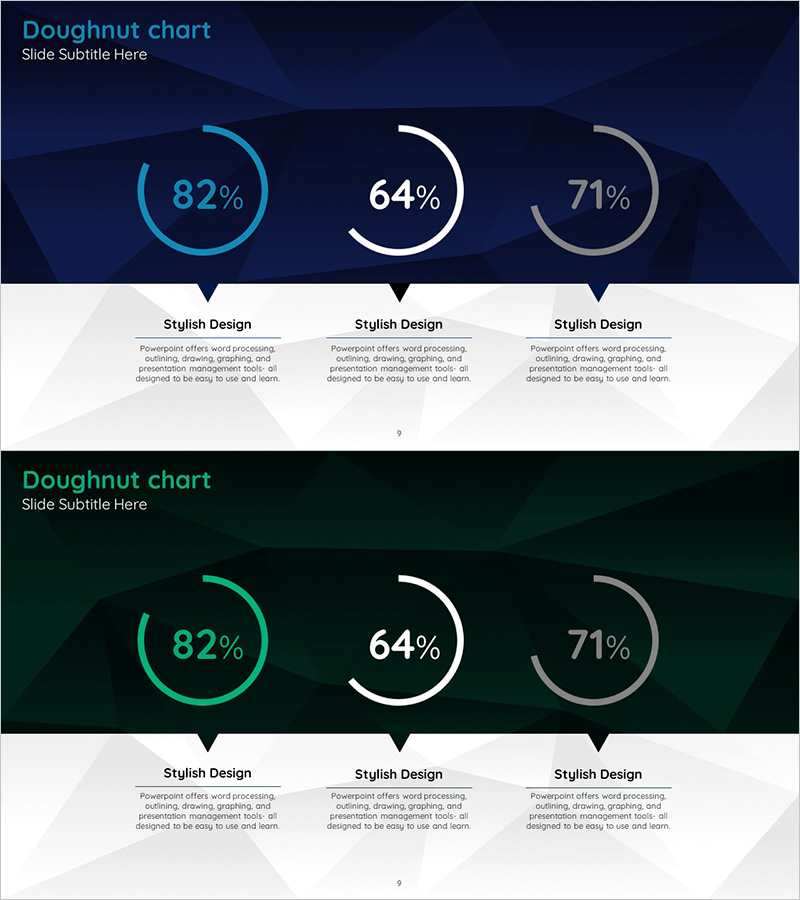
A professional donut chart PowerPoint slide designed to compare and analyze investment returns, business performance, and financial metrics across three categories. The slide features a dark blue background with three circular charts in cyan, white, and gray tones, each displaying percentage values (82%, 64%, 71%). Below each donut chart is a dedicated text area for detailed explanations and insights. The template includes two slide variations with different background colors (dark blue and dark green), allowing you to choose the best fit for your presentation context. This design effectively communicates numerical data and enhances audience comprehension of complex financial information.
Usage Points
-
Main Usage
Display and compare three key financial metrics or performance indicators using donut charts that show percentage distributions. The dedicated text areas below each chart allow you to provide context, analysis, and actionable insights alongside the visual data representation.
-
How to Use
Insert this slide into investment proposals, business plans, financial reports, quarterly performance presentations, and executive briefings. Simply edit the percentage values and colors in each donut chart to match your data, then update the text boxes below with relevant explanations and analysis for each metric.
-
Recommended For
Finance professionals, investment managers, business strategists, and executives preparing financial presentations and investment pitches. Ideal for situations requiring multi-metric comparison and data-driven decision-making presentations.
-
Slide Structure
Slide 1: Dark blue background with three donut charts displaying 82%, 64%, and 71% with descriptive text boxes beneath each. Slide 2: Identical layout with dark green background. Each donut chart features clearly defined segments and starting points for easy customization and data editing.
Related Products
-

Water Resources Donut Chart Presentation Template
#Business Strategy #Market and Competitor Analysis #Graph
-

Construction Facilities Status Donut Chart – Visualizing Business Strategies
#Business Strategy #Market and Competitor Analysis #Graph
-

Analysis of Climbing Success Rate with Doughnut Chart
#Business Strategy #Market and Competitor Analysis #Graph
-

Donut Chart for Business Strategy Visualization – Performance-Focused Marketing
#Business Introduction #Business Strategy #Marketing Plan and Strategy
