Visual Diagram Slide for Fund Management Plan
RM0500011_3
- Last Update 02/23/2025
- File Size 6.2MB
- # of Slides 2
- File Format PPTX
- Slide Ratio 16:9
- Color
Keywords
- #Content-Based Slides
- #Design-Based Slides
- #Financial Plans and Performance
- #Graph
- #Capital Requirements
- #Budget
- #Circles
- #Doughnut Chart
- #16:9
- #donut chart PowerPoint slide
- #pie chart presentation template
- #fund management cost breakdown diagram
- #circular graph slide design
- #budget allocation visualization PowerPoint
About the Product
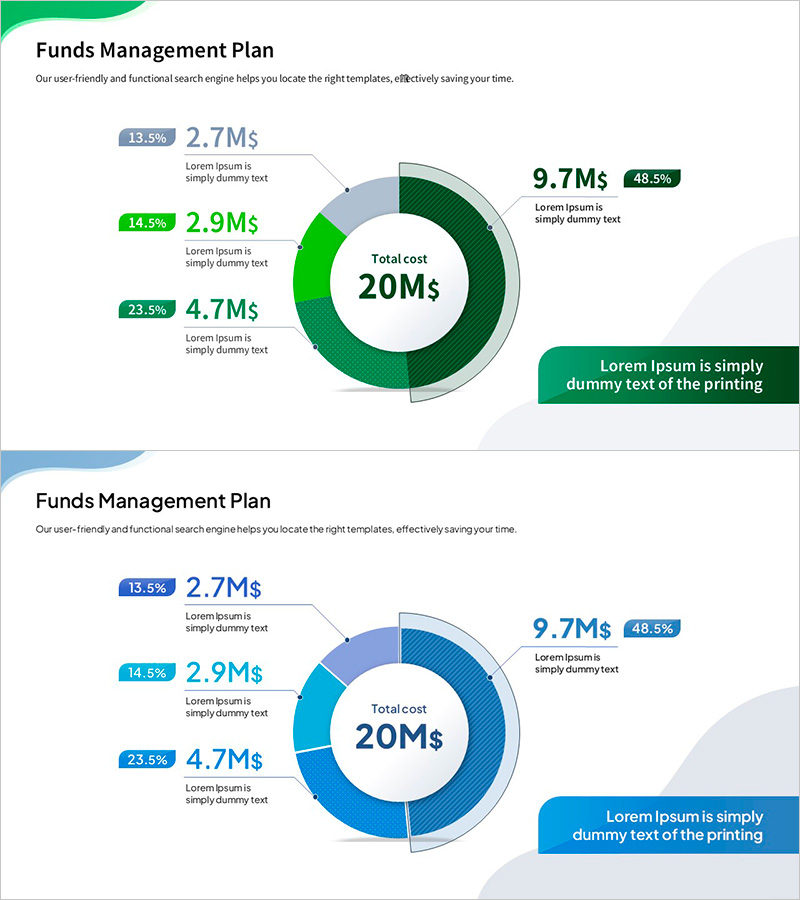
A donut chart PowerPoint slide that visualizes fund management and budget allocation with four cost segments. The center displays the total amount while surrounding sections show percentages and monetary values for each category, enabling instant financial overview. Two color versions are included—green and blue tones—with each segment clearly labeled with percentage badges and dollar amounts connected by guide lines. This presentation slide is ready to use for budget reports, financial analysis, investment pitches, and cost allocation discussions.
Usage Points
-
Main Usage
Effectively communicate budget allocation and cost distribution by displaying both percentages and monetary values simultaneously. The center total amount anchors the viewer's understanding of overall scale, while surrounding segments clearly convey the proportion of each budget category.
-
How to Use
Use in investor presentations, financial reports, budget planning meetings, and quarterly earnings calls to explain fund allocation and expense breakdown. Simply replace the sample figures with actual data and adjust colors to match your corporate branding for immediate deployment.
-
Recommended For
CFOs, financial analysts, project managers, executives, investment relations professionals, and management consultants presenting financial data. Ideal for business plans, investor pitch decks, quarterly financial reports, budget proposals, and corporate financial statements.
-
Slide Structure
Two-slide set featuring identical donut chart layouts in green and blue color schemes. Each chart displays 4 segments (13.5%, 14.5%, 23.5%, 48.5%) with percentage badges, dollar amounts, and descriptive text connected by guide lines. Center text shows 'Total cost 20M$' with supporting information box on the right.
Related Products
-

Mountain Climbing Table for Financial Planning and Performance
#Financial Plans and Performance #Diagram #Capital Requirements
-

Donut Chart Analysis and Table – Simple Data Visualization
#Financial Plans and Performance #Diagram #Graph
-

Create a Travel Budget – Strategic Planning
#Financial Plans and Performance #Diagram #Capital Requirements
-

Required Funding Plan for Summer Vacation Travel – Setting Financial Goals
#Financial Plans and Performance #Diagram #Capital Requirements
