Customer Analysis Area Chart – Data Visualization for Market Understanding
RJ0500013_10
- Last Update 06/10/2025
- File Size 5.9MB
- # of Slides 2
- File Format PPTX
- Slide Ratio 16:9
- Color
Keywords
About the Product
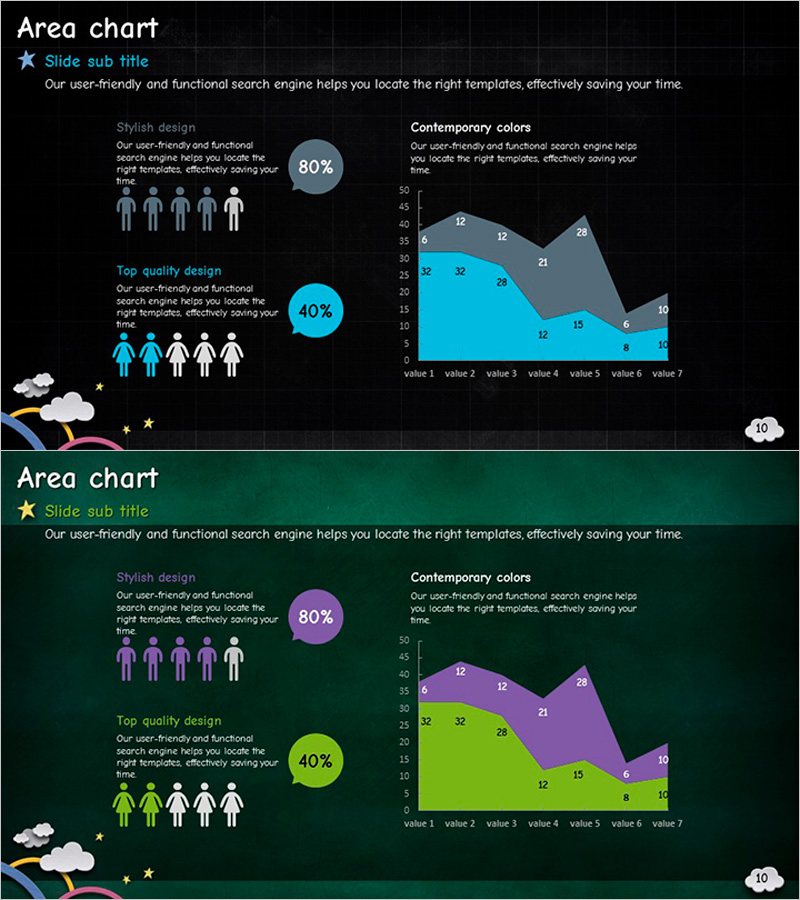
An area chart PowerPoint slide designed for customer analysis and market understanding. The slide features a dark background with cyan, purple, and lime green layered area charts that intuitively display trends across seven data points. The left section includes text descriptions and circular percentage indicators (80%, 40%) to emphasize key metrics, while the right side showcases a large-scale area chart that clearly visualizes data fluctuations over time. The 2-slide set offers design variety with different background colors (black and dark teal), and all elements are fully editable in PPTX format for immediate customization.
Usage Points
-
Main Usage
Effectively communicate multi-data trends over time in customer analysis, market overview, and competitive analysis sections. The stacked area structure allows audiences to simultaneously understand overall scale and individual item changes, making it ideal for supporting data-driven decision-making.
-
How to Use
Use in the analysis section of presentations to explain market share evolution, customer segment changes, or revenue trends. Input analysis points in the left text area and reflect actual data in the right chart to enhance audience comprehension and engagement.
-
Recommended For
Ideal for marketing plans, business analysis reports, investor pitch decks, and executive briefings. Recommended for professionals in marketing, data analysis, business intelligence, and executive management roles.
-
Slide Structure
The 2-slide set divides each slide into a left section (text and two circular chart areas for input) and a right section (large-scale area chart). Background color variations (black and dark teal) provide visual diversity, while all chart elements including colors, values, and legends are fully customizable.
Related Products
-

Running Face Graph – Market Analysis and Technology Introduction
#Technical Approach #Market and Competitor Analysis #Graph
-

Child Silhouette and Figures – Visualizing Customer Insights
#Product/Service Introduction #Market and Competitor Analysis #Graph
-

User Analysis Results Diagram - Infographic for Customer Insights
#Market and Competitor Analysis #Graph #Other
-

User Gender Ratio Analysis Diagram
#Market and Competitor Analysis #Graph #Other
