Subject Ranking Graph – Visualizing Performance
RJ0500012_13
- Last Update 06/10/2025
- File Size 0.4MB
- # of Slides 2
- File Format PPTX
- Slide Ratio 16:9
- Color
Keywords
About the Product
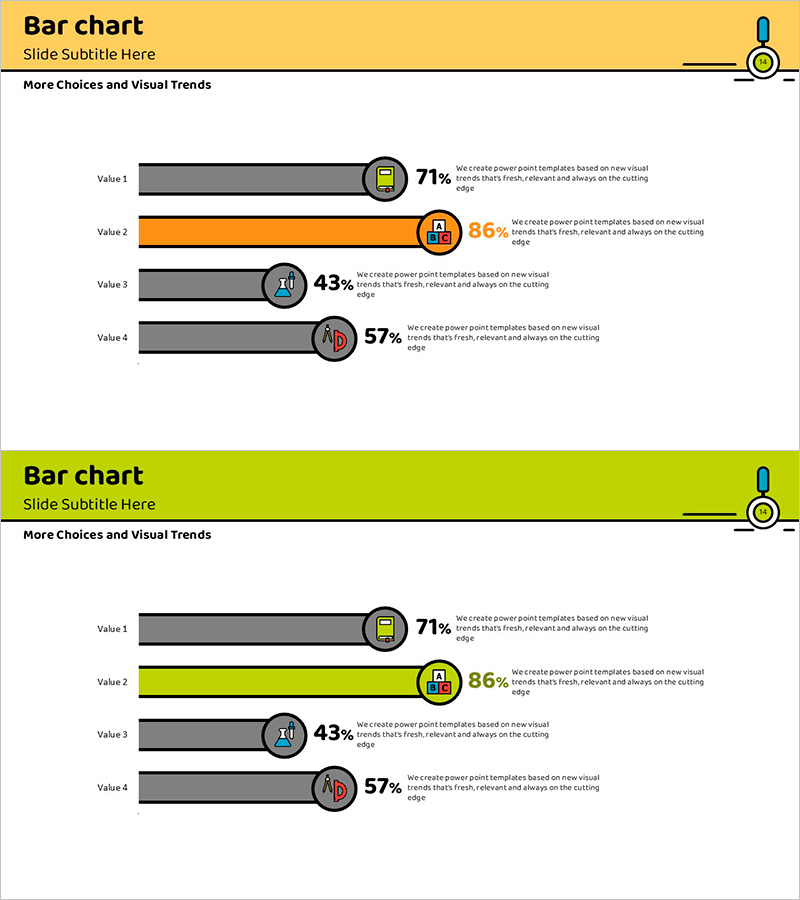
A PowerPoint slide template featuring a horizontal bar chart comparing four data items with contrasting yellow and gray color schemes. Each bar is anchored with a circular icon at the end, creating visual emphasis and data hierarchy. The 2-slide set includes a design variation to accommodate different presentation contexts. Ideal for visualizing subject rankings, departmental performance, product sales, or any comparative analysis requiring clear numerical comparison. Built in 16:9 widescreen format for modern presentation environments and fully editable in PPTX format.
Usage Points
-
Main Usage
Displays multiple data points in horizontal orientation to facilitate size comparison and ranking identification. Effectively presents four or more categories such as subject grades, departmental results, product sales figures, or customer satisfaction metrics in a single, easy-to-read format.
-
How to Use
Modify bar lengths to input actual data values and update text labels with item names and corresponding figures. Circular icons can be replaced with symbols representing each category's characteristics, and colors are fully customizable to match corporate branding guidelines.
-
Recommended For
Business performance reports, marketing analysis presentations, educational assessments, departmental performance reviews, product sales updates, and any presentation requiring quantitative comparison. Particularly effective for executive briefings and academic evaluations emphasizing ranking or relative magnitude.
-
Slide Structure
Two-slide set with identical layouts featuring four horizontal bars, data labels, and circular icons per slide. First slide emphasizes yellow accent; second slide features gray accent, allowing flexible application for presenting different data sets or comparison scenarios.
Related Products
-

Striking Performance Gap in Agricultural Outcomes
#Business Strategy #Financial Plans and Performance #Graph
-

Strategic Goal Progress Template
#Business Strategy #Diagram #Graph
-

Popular Snack Graph for Revenue Visualization – Simplicity and Intuition
#Business Strategy #Financial Plans and Performance #Graph
-

Preferred Menu Survey Visualization with Horizontal Bar Chart
#Company Introduction #Business Strategy #Graph
