Two Types of Donut Charts – Effective Market Analysis Tool
RJ0500011_5
- Last Update 06/10/2025
- File Size 4.1MB
- # of Slides 2
- File Format PPTX
- Slide Ratio 16:9
- Color
Keywords
About the Product
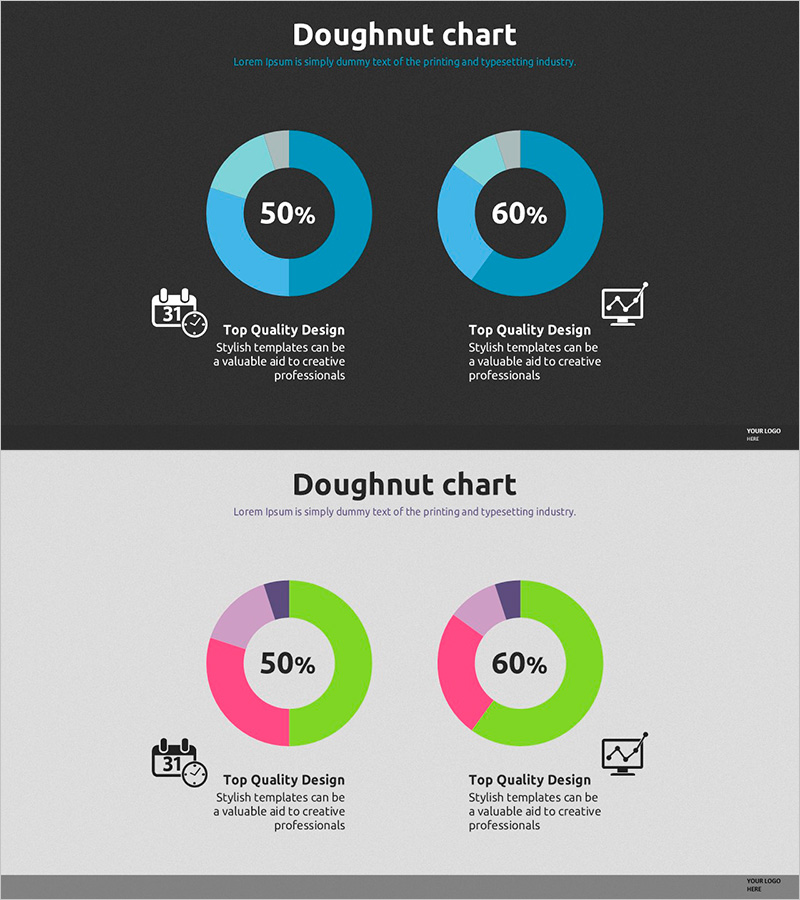
A professional doughnut chart PowerPoint slide set designed for market analysis and data comparison presentations. This template features two distinct design variations: a dark blue gradient version and a vibrant multi-color palette with pink, green, and purple tones. Each slide displays two doughnut graphs side-by-side, enabling simultaneous comparison of multiple metrics. The center of each doughnut displays percentage values for intuitive data interpretation. Icons and descriptive text labels accompany each chart to clarify data meaning. This ready-to-use PowerPoint slide template is ideal for business reports, competitive analysis, and executive presentations.
Usage Points
-
Main Usage
Visualize component ratios and proportional relationships using doughnut chart graphics. Ideal for displaying market share, customer demographics, product sales distribution, and budget allocation. The dual-chart layout enables side-by-side comparison across time periods, regions, or competitors.
-
How to Use
Input your actual data into each doughnut graph and adjust the proportions accordingly. Update the center percentage values to match your data, then customize the icons and descriptive text to fit your presentation context. Use the blue gradient version for corporate reports and the multi-color version for creative or marketing presentations.
-
Recommended For
Marketing professionals, executives, data analysts, and consultants presenting market analysis, business performance reports, and competitive positioning. Suitable for quarterly earnings presentations, investor pitch decks, and strategic planning meetings.
-
Slide Structure
Two-slide set with dual doughnut charts per slide arranged horizontally. Each doughnut displays a centered percentage value. Slide 1 features dark blue to light blue gradient tones; Slide 2 uses pink, green, and purple multi-color scheme. Icons and text description areas are positioned below each chart for context and clarity.
Related Products
-

Paint Splash Bar Chart Template – Market Analysis and Strategy
#Market and Competitor Analysis #Marketing Plan and Strategy #Graph
-

Survey and Poll Analysis Graphs – Optimized for Market Analysis
#Market and Competitor Analysis #Diagram #Graph
-

Status Analysis Donut Chart – Shareholder Status Analysis
#Company Introduction #Market and Competitor Analysis #Diagram
-

Shareholder Status Distribution Analysis Chart – Visualizing Shareholder Information
#Company Introduction #Market and Competitor Analysis #Diagram
