Simple Circle Presentation Template Line Chart – Visualizing Market Status
RJ0200013_26
- Last Update 04/01/2025
- File Size 0.4MB
- # of Slides 2
- File Format PPTX
- Slide Ratio 16:9
- Color
Keywords
- #Content-Based Slides
- #Design-Based Slides
- #Market and Competitor Analysis
- #Graph
- #Market Status
- #Future Outlook
- #Line
- #Line Chart
- #16:9
- #line chart PowerPoint slide
- #dual-series trend comparison
- #how to create line chart in PowerPoint
- #market analysis presentation template
- #competitive analysis slide
- #time-series data visualization
About the Product
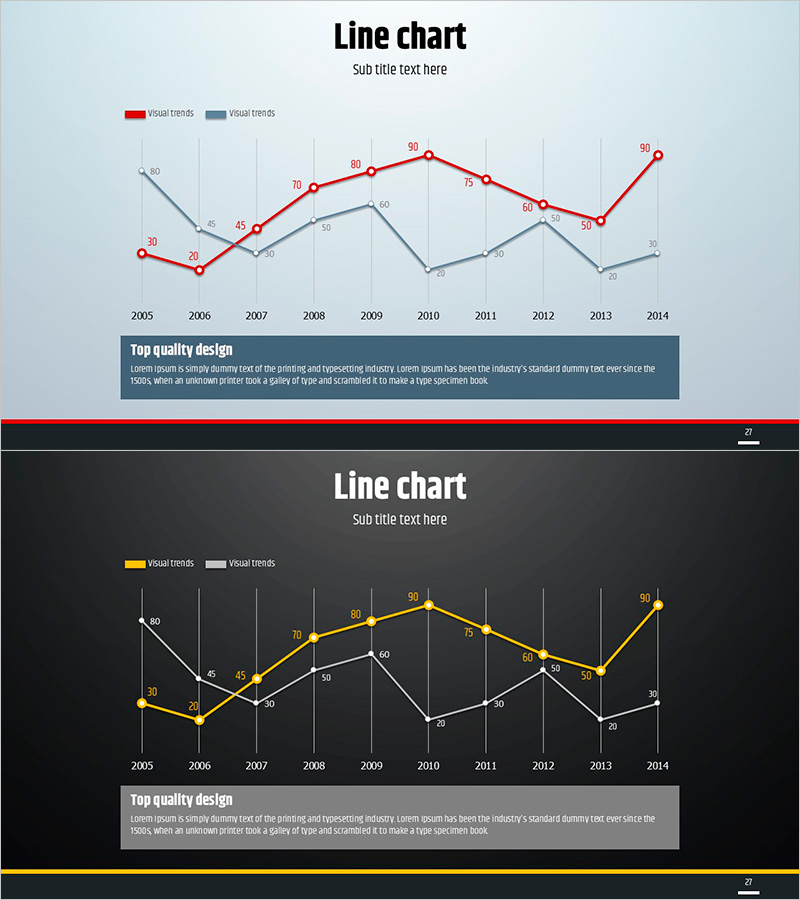
A professional line chart PowerPoint slide that visualizes the change trends of two different metrics over time. This presentation template includes two versions: a light background design and a dark background design. The dual data series are distinguished by contrasting red and blue color schemes, with data point values clearly labeled for precise comparison. The grid background ensures easy readability and professional appearance. Ideal for market analysis, competitive benchmarking, sales performance tracking, and strategic presentations in business reports, investor pitches, and quarterly reviews.
Usage Points
-
Main Usage
Display and compare two different data series over a 10-year period to reveal trends, correlations, and performance patterns. Perfect for presenting sales growth, market share evolution, customer satisfaction scores, KPI comparisons, and competitive positioning analysis.
-
How to Use
Use the light background version for conference rooms, seminars, and indoor presentations. Deploy the dark background version for outdoor projections, large-scale events, and high-contrast environments. Edit data point values, axis labels, and legend text to match your specific dataset and presentation context.
-
Recommended For
Executives, marketing teams, sales professionals, data analysts, and management consultants presenting quarterly performance reviews, market research findings, competitive analysis, and strategic planning initiatives. Essential for business plans, investor presentations, marketing proposals, and annual reports.
-
Slide Structure
Two-slide set: ① Light background version (soft blue) with red and blue dual-series lines, 10 data points spanning 2005-2014, labeled values, legend, title, and description area ② Dark background version (charcoal gray) with yellow and white line series, optimized for high-contrast visibility and professional impact
Related Products
-

Two Comparison Line Graphs – Market Status and Future Outlook
#Market and Competitor Analysis #Graph #Market Status
-

Market Status and Future Outlook – Data Illustrated in Blue and Yellow
#Market and Competitor Analysis #Graph #Market Status
-

Electricity and Water Usage Graphs – Market Status and Future Trends
#Market and Competitor Analysis #Graph #Market Status
-

Four Color Infographic Presentation Template – Market Status and Forecast
#Market and Competitor Analysis #Graph #Market Status
