Donut Chart Visualizing Cybersecurity Development Status
RJ0400069_13
- Last Update 06/06/2025
- File Size 3.4MB
- # of Slides 2
- File Format PPTX
- Slide Ratio 16:9
- Color
Keywords
- #Content-Based Slides
- #Design-Based Slides
- #Product/Service Introduction
- #Market and Competitor Analysis
- #Graph
- #Development Status
- #Market Share
- #Circles
- #Doughnut Chart
- #16:9
- #donut chart PowerPoint
- #donut chart slide template
- #ratio visualization PPT
- #2-segment pie chart
- #data comparison presentation slide
About the Product
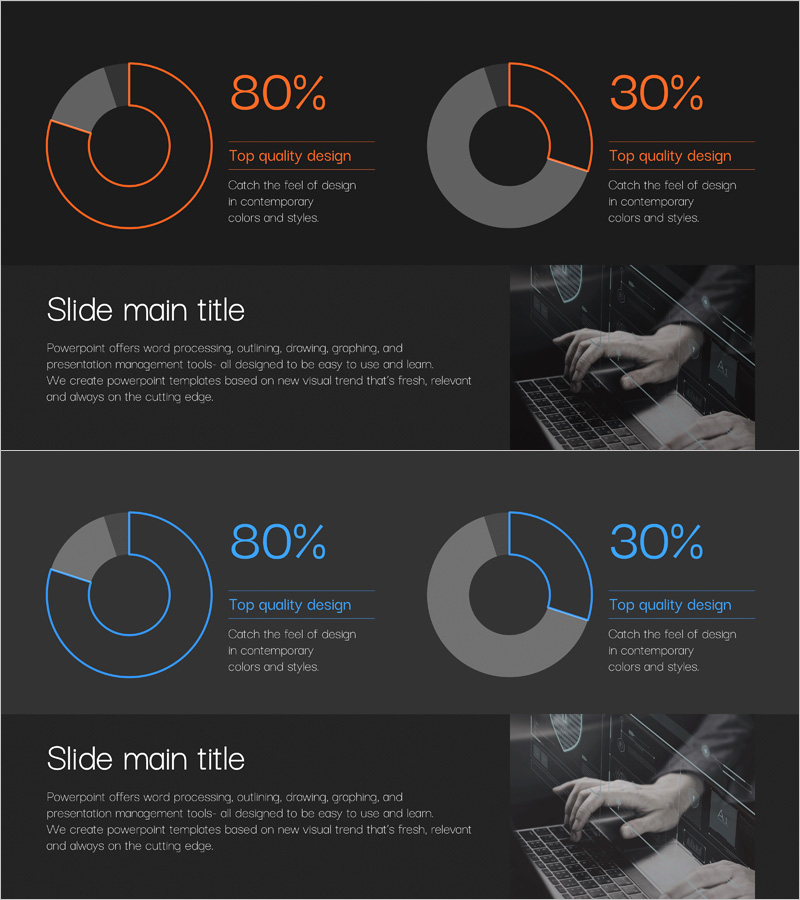
A professional donut chart PowerPoint slide template for visualizing cybersecurity development status, project progress rates, budget allocation, and other two-item comparisons at a glance. The dark background with orange and blue outline accents creates a contemporary and authoritative presentation atmosphere. Each slide features percentage values and descriptive text areas positioned for clear data interpretation. Composed of 2 slides in 16:9 widescreen format, with fully editable colors and numerical values to match your specific data and branding requirements.
Usage Points
-
Main Usage
Clearly visualize proportional relationships between two data categories such as project completion rates, budget distribution, market share, and development status. The hollow center of the donut chart provides space to emphasize key metrics or titles, directing audience attention to critical information.
-
How to Use
Insert into data comparison sections of business reports, investor presentations, and technical briefings. Replace percentage values and descriptive text with your actual data, and adjust colors as needed to align with corporate branding and visual identity standards.
-
Recommended For
Ideal for IT companies presenting cybersecurity status updates, development teams reporting project progress, finance departments explaining budget allocation, and marketing teams analyzing market segments. Suitable for technology leaders, project managers, financial analysts, and executives supporting data-driven decision-making.
-
Slide Structure
2-slide set. Each slide features a dark background with two donut charts side-by-side. The left chart uses orange outline styling while the right chart uses blue outline for visual distinction. Percentage values and descriptive text labels are positioned adjacent to each chart. A dedicated image area in the lower right allows insertion of supporting photography or supplementary visuals.
Related Products
-

Business Idea Development Status Graph – Ideas and Growth
#Product/Service Introduction #Market and Competitor Analysis #Graph
-

Graph of Analysis of Transportation Development Status
#Product/Service Introduction #Market and Competitor Analysis #Graph
-

Space Exploration Donut Pie Chart
#Product/Service Introduction #Market and Competitor Analysis #Graph
-

Development Status Analysis Donut Chart – Market Share Visualization
#Product/Service Introduction #Market and Competitor Analysis #Graph
