Learning Category Analysis Graph Comparison
RJ0500008_7
- Last Update 06/09/2025
- File Size 2.9MB
- # of Slides 2
- File Format PPTX
- Slide Ratio 16:9
- Color
Keywords
- #Content-Based Slides
- #Design-Based Slides
- #Market and Competitor Analysis
- #Graph
- #Competitive Advantage
- #Horizontal Bar
- #Horizontal Bar Chart
- #16:9
- #horizontal bar chart PowerPoint
- #dual-series chart template
- #learning category analysis slide
- #comparison chart design
- #data visualization PowerPoint slide
About the Product
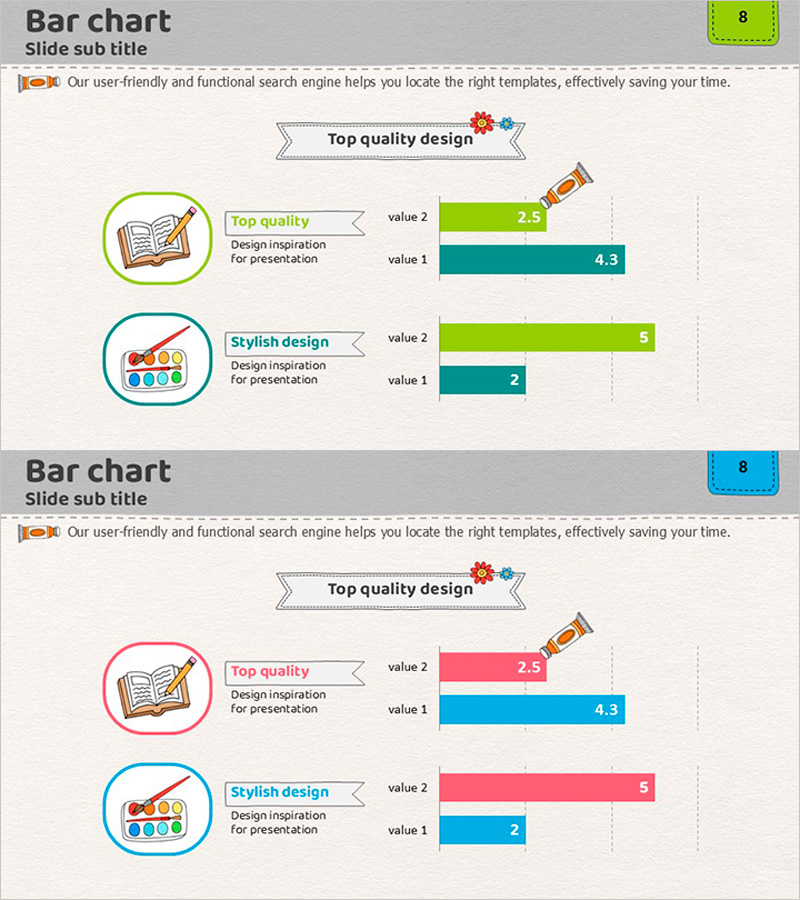
A horizontal bar chart PowerPoint slide designed for learning category analysis and data comparison. This presentation template features two color-coded series—lime green and teal—allowing side-by-side comparison of two data sets. Each category is labeled with an icon on the left, while numerical values are clearly displayed on the bars for easy interpretation. Ideal for educational presentations, market analysis reports, competitive benchmarking, and performance evaluation slides that require clear quantitative comparison.
Usage Points
-
Main Usage
This slide enables side-by-side comparison of two data sets or categories using horizontal bars. It is designed for quantitative comparisons such as learning outcome analysis, market share evaluation, competitive benchmarking, educational effectiveness measurement, and performance metrics across different segments.
-
How to Use
Replace the category labels and icons on the left with your comparison items, then update the bar lengths and numerical values to match your actual data. The dual color scheme (lime green and teal) automatically differentiates the two series, allowing immediate use in presentations without additional formatting.
-
Recommended For
Educational institutions presenting learning performance analysis, corporate market research and competitive analysis reports, marketing teams comparing customer segments, consulting firms conducting benchmarking studies, academic presentations, and research findings explanations.
-
Slide Structure
Two-slide set with identical dual-series horizontal bar chart layouts. Each slide features circular icons and labels on the left, a legend in the center (lime green and teal), and two horizontal bars with numerical values (0–5 range) on the right side for direct data comparison.
Related Products
-

India Travel-Related Business Overview and Market Share – Market Status Analysis
#Market and Competitor Analysis #Graph #Market Status
-

Children’s Activity Preferences Comparison – Market Status and Competitive Advantage
#Market and Competitor Analysis #Graph #Market Status
-

Design Style Preference Analysis – Insights into Market Competition
#Market and Competitor Analysis #Financial Plans and Performance #Graph
-

Meat and Vegetable Consumption by Region – Market Status Analysis
#Market and Competitor Analysis #Graph #Other
