Learning Illustrations and Table Charts – Visualizing Financial Performance
RJ0500008_13
- Last Update 06/09/2025
- File Size 3MB
- # of Slides 2
- File Format PPTX
- Slide Ratio 16:9
- Color
Keywords
- #Content-Based Slides
- #Design-Based Slides
- #Financial Plans and Performance
- #Diagram
- #Income Statement
- #Key Financial Indicators
- #Table
- #Standard Table
- #16:9
- #table chart PowerPoint
- #financial data visualization presentation
- #5-row table slide
- #performance metrics template
- #data comparison slide download
About the Product
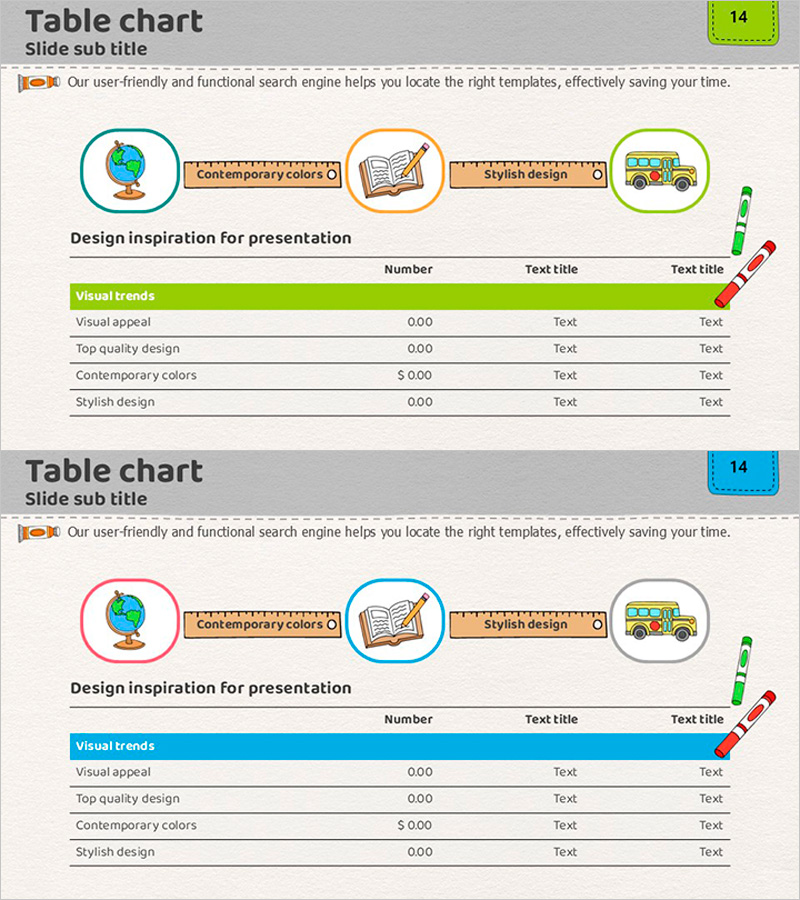
A PowerPoint slide combining learning illustrations with a 5-row table chart for presenting financial performance, key metrics, and income statements. The top section features colorful icon illustrations (globe, book, bus) that intuitively convey your presentation theme, while the color-coded header rows (green, orange, blue) and white background create clear information hierarchy. The 2-slide set is optimized for 16:9 widescreen format and allows you to visualize multiple data sets. Fully editable PPTX format enables quick customization of numbers, labels, and colors to match your specific data and branding.
Usage Points
-
Main Usage
Present financial performance, sales results, key performance indicators (KPIs), income statements, and cost analysis in a clear tabular format. The icon illustrations at the top intuitively communicate your presentation topic (learning, education, or business) to the audience.
-
How to Use
Use in financial reports, business performance presentations, quarterly results analysis, and budget planning meetings as your data comparison section. Replace the sample numbers and text with your actual data, and adjust header colors or add rows as needed for your specific requirements.
-
Recommended For
Finance professionals, executives, business analysts, educators, and consultants who need to present data-driven insights. Ideal for quarterly performance reviews, investor reports, internal performance meetings, and financial planning presentations.
-
Slide Structure
2-slide set with each slide featuring 3 icon illustrations (globe, book, bus) in colored circular frames at the top, connected by arrows, followed by a 5-row table (1 header row + 4 data rows, 3 columns). First slide uses green header; second slide features blue header for design variation.
Related Products
-

Key Financial Indicators Table – Trust and Professionalism
#Financial Plans and Performance #Diagram #Income Statement
-

Table of Key Financial Indicators to Highlight
#Financial Plans and Performance #Diagram #Income Statement
-

Income Statement Table – Clearly Presenting Financial Plans and Performance
#Financial Plans and Performance #Diagram #Income Statement
-

Modern Styled Table Chart for Data Visualization – Clarity and Precision
#Financial Plans and Performance #Diagram #Income Statement
