Infant Content Introduction Infographic – Clear Presentation Slide
RJ0500008_10
- Last Update 06/09/2025
- File Size 2.8MB
- # of Slides 2
- File Format PPTX
- Slide Ratio 16:9
- Color
Keywords
About the Product
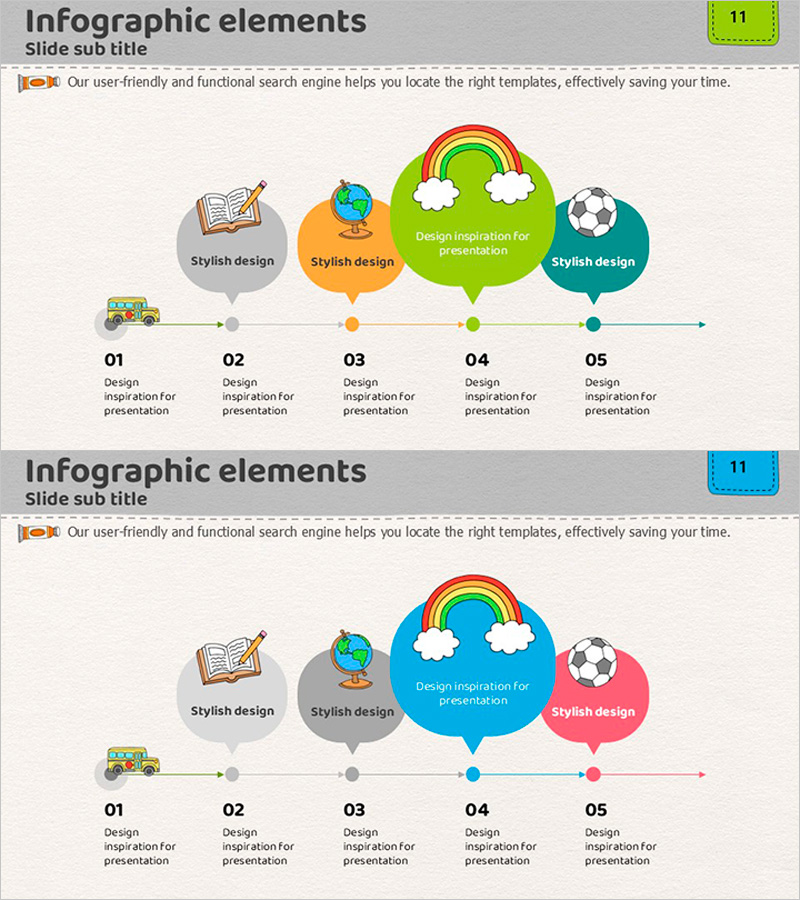
A linear infographic PowerPoint slide featuring five sequential steps connected from left to right. Each step is represented by a circular speech bubble containing an icon and text label, linked by a central timeline. The design uses five distinct colors—gray, orange, green, blue, and teal—to differentiate each stage, with diverse icons such as a book, globe, rainbow, and soccer ball adding visual interest. This presentation slide effectively communicates sequential processes, developmental stages, learning pathways, and project timelines with clarity and visual appeal.
Usage Points
-
Main Usage
Ideal for explaining sequential processes, developmental stages, learning pathways, and project timelines in chronological order. Icons visually represent each stage's core concept, enhancing audience comprehension and engagement.
-
How to Use
Apply to company history in corporate profiles, product development roadmaps, campaign phases in marketing plans, and curriculum progression in educational materials. Freely edit text and icons to match various presentation contexts and requirements.
-
Recommended For
Suitable for corporate strategy presentations, educational institution curriculum explanations, startup growth stage introductions, and marketing team campaign roadmap presentations. Recommended for any presentation requiring visual clarity and sequential information flow.
-
Slide Structure
Two-slide layout. The first slide features five nodes connected horizontally in a timeline structure, with each node comprising a circular speech bubble, icon, and text label. The second slide presents an alternative color version of the same structure. Optimized for 16:9 widescreen format.
Related Products
-

Introduction Slide Using Shapes – Clarity and Simplicity
#Product/Service Introduction #Business Strategy #Diagram
-

Linear Diagram Slide for Business Implementation Strategy – Presenting the Blueprint
#Business Strategy #Business Management #Diagram
-

Execution Plan for Maximizing Asset Returns – Cluster and Connection Diagram
#Product/Service Introduction #Business Management #Diagram
-

Visualizing Service Marketing Strategy and Plan Slide
#Business Strategy #Business Management #Marketing Plan and Strategy
