Planning and Process Diagrams – Blue, Orange, Green
RJ0400017_22
- Last Update 05/22/2025
- File Size 0.2MB
- # of Slides 2
- File Format PPTX
- Slide Ratio 16:9
- Color
Keywords
- #Content-Based Slides
- #Design-Based Slides
- #Business Management
- #Operational Plan
- #Diagram
- #Execution Plan
- #Business Processes
- #Flow
- #Linear Flow
- #16:9
- #linear process diagram PowerPoint
- #5-step flow chart slide
- #process flow template download
- #business process diagram PPT
- #how to create process flow in PowerPoint
About the Product
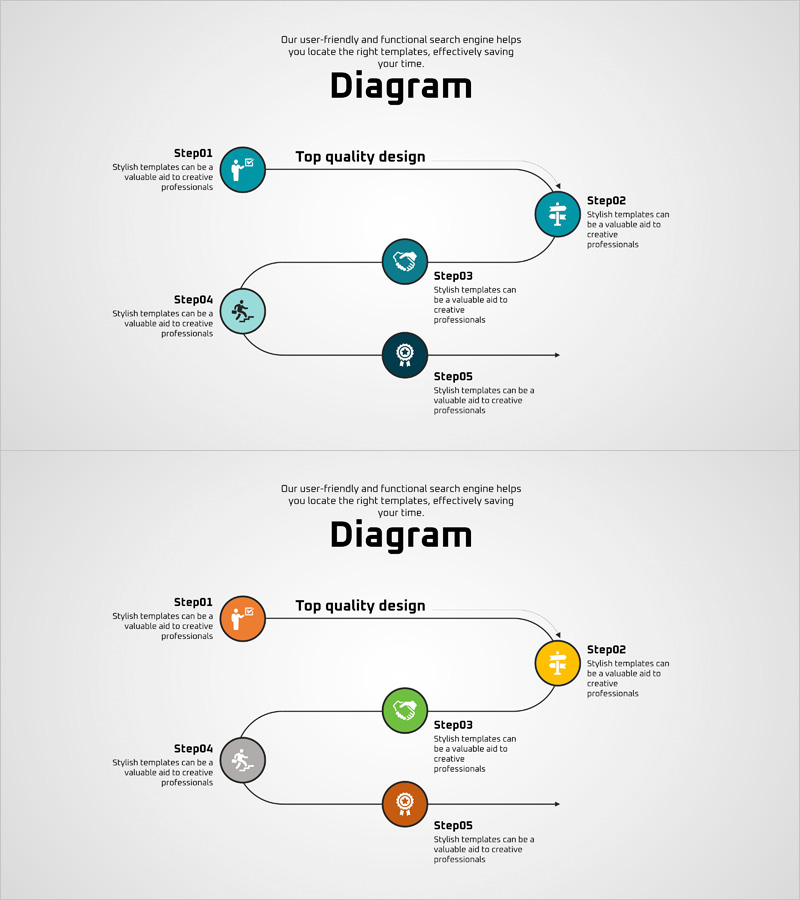
A PowerPoint slide set visualizing a 5-step linear process flow. Available in three color versions—blue, orange, and green—with icons and descriptive text for each stage. The node-based diagram connected by arrows clearly represents planning, process workflows, and phased implementation strategies. Ideal for business presentations, project management, and operational planning, this slide template is ready to use and fully editable for your specific content.
Usage Points
-
Main Usage
Optimized for visualizing project plans, business processes, and operational procedures in sequential stages. Each step combines icons and text to clearly communicate objectives and execution details, emphasizing linear progression and workflow continuity.
-
How to Use
Use in the strategy and planning sections of presentations to explain project roadmaps, marketing campaign phases, product development processes, or organizational change management. Edit the node text and icons to customize the diagram for your specific content and audience.
-
Recommended For
Project managers, strategy planners, operations specialists, consultants, and educators explaining process flows. Suitable for business plans, proposals, marketing strategies, and operational planning presentations.
-
Slide Structure
Two-slide set featuring blue version on one slide and orange/green versions on another. Each slide displays five circular icon nodes connected by arrows from left to right, with stage labels and descriptive text areas positioned below each node.
Related Products
-

Geometry PPT Template Wide Diagram3 – Business Management and Operation Plan
#Business Management #Operational Plan #Diagram
-

Diagram for Step-by-Step Planning – Enhancing Business Management and Efficiency
#Business Management #Operational Plan #Diagram
-

Paint Splash Diagram Template – Visualizing Operation Plan
#Business Management #Operational Plan #Diagram
-

Communication System Diagram – Effective Information Delivery
#Business Management #Operational Plan #Diagram
