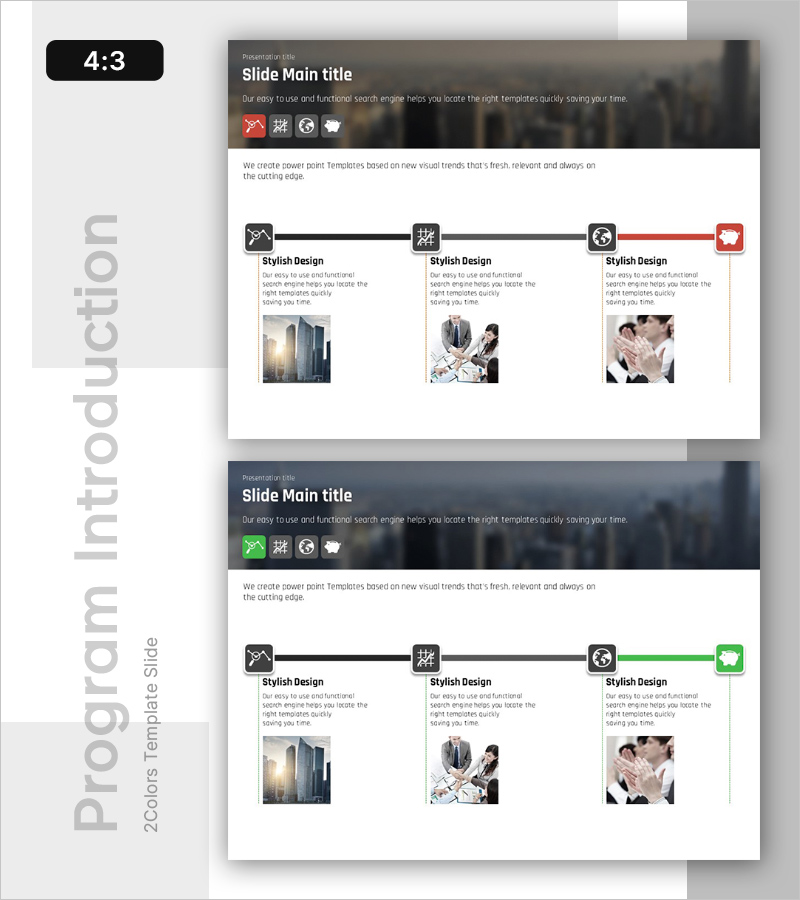
Execution Plan for Maximizing Asset Returns – Cluster and Connection Diagram
RB0100053_4
- Last Update 03/06/2025
- File Size 3MB
- # of Slides 2
- File Format PPTX
- Slide Ratio 4:3
- Color
Keywords
- #Content-Based Slides
- #Design-Based Slides
- #Product/Service Introduction
- #Business Management
- #Diagram
- #Program Introduction
- #Execution Plan
- #Cluster
- #Chain Diagram
- #4:3
- #cluster diagram PowerPoint
- #connection diagram slide
- #network structure presentation
- #business strategy diagram
- #execution plan PowerPoint slide template
About the Product
A cluster and connection diagram PowerPoint slide that visualizes asset return optimization strategy. The design features a central hub radiating to four key nodes in a network structure, clearly expressing each stage of execution plan. Built on a dark background with black, gray, and red icons connected by black lines, it is optimized for the strategy section of business presentations. The 2-slide set provides the same structure in two color themes (gray and green tones) so you can choose based on your presentation context. Fully editable in PowerPoint format, allowing you to customize text and icons freely.
Usage Points
-
Main Usage
Visualizes complex execution plans for asset management, return optimization, and strategy development using a node-based network. The hub-and-spoke structure clearly expresses the relationship between core strategy and detailed action items, making it highly effective for presentations to executives and investors.
-
How to Use
Enter your core objective (e.g., Asset Return Optimization) in the central node, then place key execution strategies (e.g., Portfolio Diversification, Risk Management, Revenue Generation, Performance Monitoring) in the four surrounding nodes. Add detailed description text below each node to complete your multi-level strategy framework.
-
Recommended For
Ideal for executives, CFOs, investment managers, and strategy planning teams explaining business strategy, asset management plans, organizational restructuring, or project implementation frameworks. Particularly suited for finance, asset management, consulting, and corporate executive presentations.
-
Slide Structure
4:3 aspect ratio with 2 slides. Each slide features a central hub (1 node) radiating to four surrounding nodes in a cluster structure, connected by black lines. Slide 1 uses gray tones while Slide 2 uses green tones for color variation. Each node includes an icon and text input area for customization.
Related Products
-

Connected Business Timeline – Effective Business Implementation Strategy
#Product/Service Introduction #Business Strategy #Diagram
-

Diagram for Effectively Presenting Astronomy Programs
#Product/Service Introduction #Marketing Plan and Strategy #Diagram
-

Effective Diet Method - Realizing Through Step-by-Step Planning
#Business Strategy #Business Management #Diagram
-

Treatment Process Diagram – Essential for Business Management
#Business Strategy #Business Management #Diagram
