Two Comparative Table Charts – Market Analysis and Competitive Overview
RJ0500006_6
- Last Update 06/09/2025
- File Size 0.6MB
- # of Slides 2
- File Format PPTX
- Slide Ratio 16:9
- Color
Keywords
About the Product
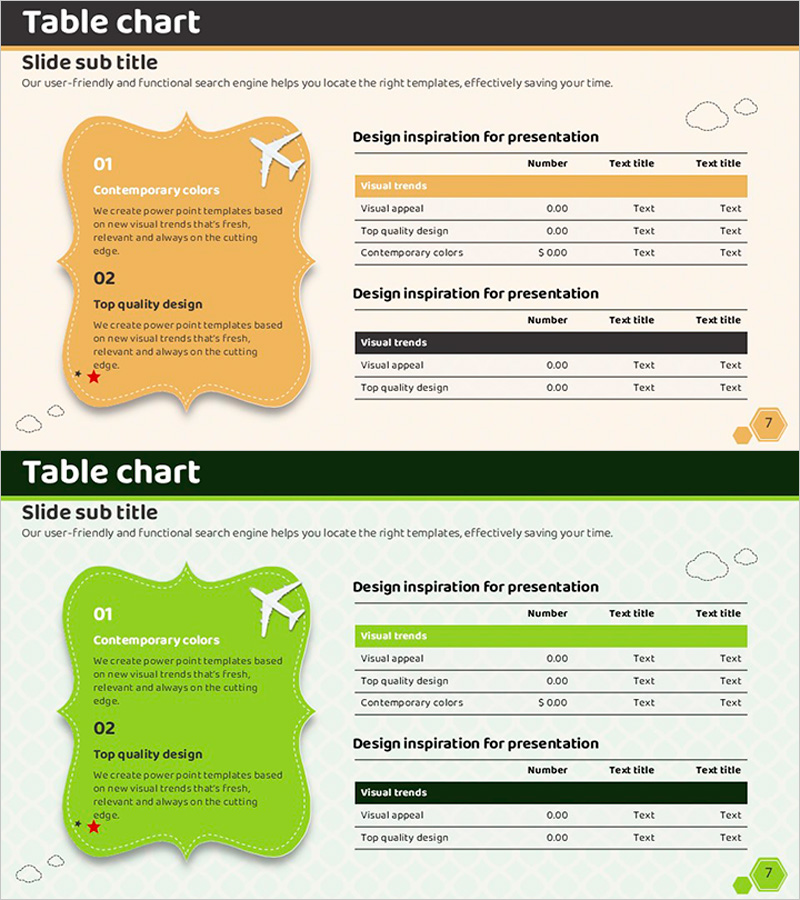
A 2-slide PowerPoint presentation featuring comparative table charts for market analysis and competitive overview. Available in two color versions—golden orange and vibrant green—each slide contains a structured data table with three rows of comparison items (Visual trends, Visual appeal, Top quality design, Contemporary colors). The left side features a sticky note-shaped text box for highlighting key points, while the right side displays a clean table layout for systematic data comparison. Designed in 16:9 widescreen format as an editable PPTX file, enabling quick customization for competitive analysis, market positioning, and product feature comparisons in business presentations.
Usage Points
-
Main Usage
Presents side-by-side comparison of two subjects—such as market segments, competitor products, or strategic options—using structured table format. Each table organizes data into numbered rows with item names, numerical values, and descriptions, ensuring clear information hierarchy and audience comprehension.
-
How to Use
Enter comparison subject names (e.g., Competitor A, Competitor B) in the left sticky note-shaped text box. Fill in comparison metrics and values in the right table rows. Select either the golden orange or vibrant green color version based on your presentation theme and content focus.
-
Recommended For
Ideal for marketing strategy decks, business proposals, investor pitch presentations, and executive reports requiring competitive analysis, market positioning, or product feature comparison. Suitable for sales teams, marketing departments, and C-level presentations demanding data-driven insights.
-
Slide Structure
2-slide set. Each slide combines a left sticky note-shaped text box (2-item input area) with a right-aligned table (3 rows: Visual trends, Visual appeal, Top quality design, Contemporary colors). One golden orange version and one vibrant green version included.
Related Products
-

Camping Competitor Characteristic Analysis Pentagon Graph
#Market and Competitor Analysis #Diagram #Graph
-

Market Trend Analysis Mixed Graph & Table
#Market and Competitor Analysis #Diagram #Graph
-

Market Trend Analysis Broken Line Graph – Competitor Analysis
#Market and Competitor Analysis #Diagram #Graph
-

Market Trend Analysis Graph & Table Chart
#Market and Competitor Analysis #Diagram #Graph
