Market Trend Analysis Mixed Graph & Table
RM0400006_6
- Last Update 02/16/2025
- File Size 1MB
- # of Slides 2
- File Format PPTX
- Slide Ratio 16:9
- Color
Keywords
- #Content-Based Slides
- #Design-Based Slides
- #Market and Competitor Analysis
- #Diagram
- #Graph
- #Other
- #Competitor Analysis
- #Industry Trends
- #Table
- #Standard Table
- #16:9
- #market trend graph PowerPoint
- #mixed chart slide template
- #bar line chart PowerPoint
- #market analysis table slide
- #competitive analysis chart download
About the Product
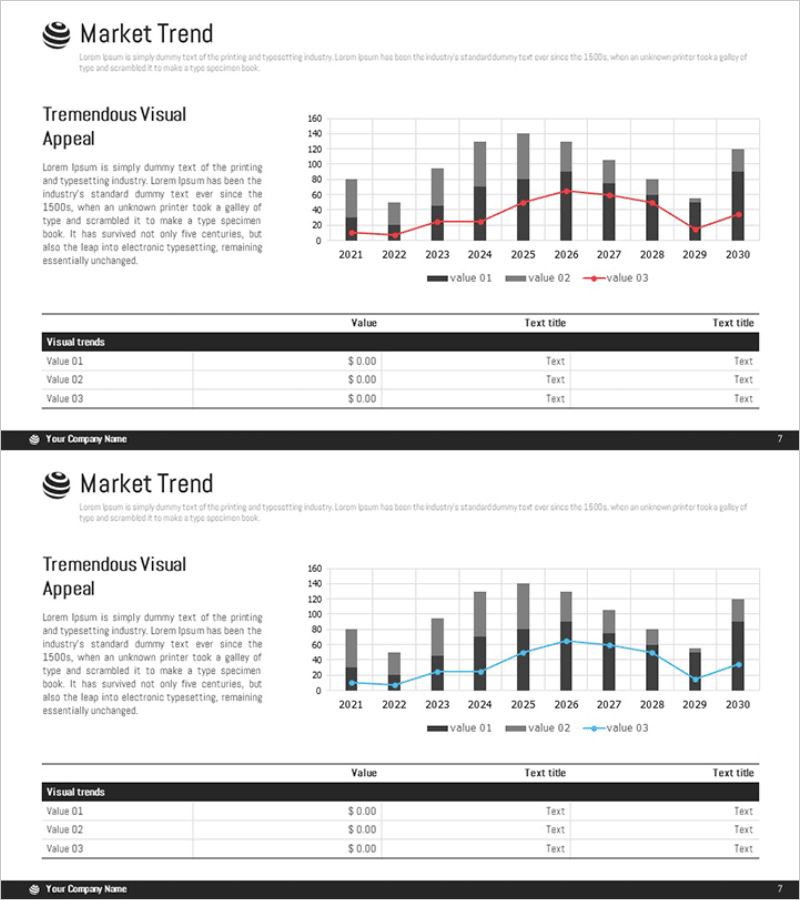
A comprehensive mixed-chart PowerPoint slide for multi-layered market trend analysis. Combines three-series bar graphs (value 01, 02, 03) with a red trend line to simultaneously display numerical comparisons and change patterns from 2021 to 2030. A data table below provides specific figures for reference. Ideal for competitive analysis, market size tracking, and decision-making presentations in business reports and strategic planning.
Usage Points
-
Main Usage
Present multi-dimensional market data—such as market size, competitor performance, and industry trends—using combined bar and line charts, with a supporting data table for detailed figures and decision-making context.
-
How to Use
Enter actual values into the three-series bar chart; they update automatically. Use the red trend line to emphasize directional change. Customize the data table below with item names, figures, and descriptions to match your presentation narrative.
-
Recommended For
Executive reports, market analysis presentations, investor pitch decks (IR), business plan market overview sections, quarterly performance reviews, and competitive strategy meetings.
-
Slide Structure
Title area at top, central mixed chart (horizontal axis 2021–2030, vertical axis 0–160, three bar series plus one trend line), and data table below (Visual trends row, Value and Text title columns) across 2 slides.
Related Products
-

Competitor Analysis Broken Line Graph – Visualizing Market Trends
#Market and Competitor Analysis #Graph #Other
-

Competitor Analysis by Year Bundled Graph – Market Trend Insights
#Market and Competitor Analysis #Diagram #Graph
-

Comparison Chart of Pet Expenditure – Essential Template for Competitor Analysis
#Market and Competitor Analysis #Diagram #Graph
-

Market Trend Analysis Mixed Chart – Capturing Data and Insights
#Market and Competitor Analysis #Graph #Other
