Robot Market Analysis Bar Chart – Competitive Data Visualization
RJ0400072_23
- Last Update 06/07/2025
- File Size 0.6MB
- # of Slides 2
- File Format PPTX
- Slide Ratio 16:9
- Color
Keywords
- #Content-Based Slides
- #Design-Based Slides
- #Market and Competitor Analysis
- #Graph
- #Competitor Analysis
- #Market Analysis
- #Horizontal Bar
- #Segmented Horizontal Bar
- #16:9
- #horizontal bar chart PowerPoint
- #bar graph slide template
- #data comparison chart
- #market analysis PowerPoint
- #competitive analysis slide
About the Product
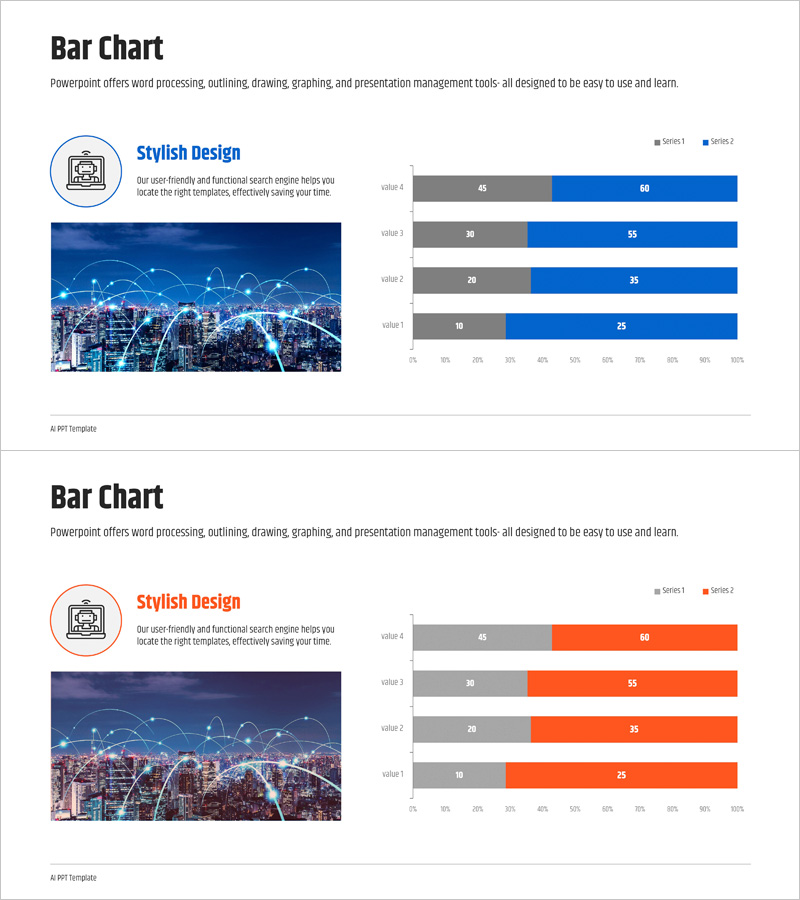
A horizontal bar chart PowerPoint slide designed for robot market analysis, competitive comparison, and sales performance visualization. The slide features two data series (gray and blue, or orange) displayed side-by-side across four items, with a 0–100% scale on the horizontal axis. Each bar includes precise numerical labels for clear data interpretation. Ideal for business reports, market analysis presentations, and competitive intelligence decks. Provided in 16:9 PPTX format with fully editable colors, values, and labels.
Usage Points
-
Main Usage
Visualize comparative data across multiple categories—such as robot market segments, competitor market share, sales figures, or performance metrics—where two or more data series need to be displayed side-by-side for clear numerical contrast.
-
How to Use
The bar length and color coding instantly convey numerical differences between items and series. Deploy in market analysis sections of business reports, executive briefings, investor presentations, and competitive intelligence decks to strengthen data credibility.
-
Recommended For
Market analysts, marketing managers, executives, management consultants, and sales teams presenting robot/AI industry insights, market positioning, or competitive benchmarking. Especially suited for B2B presentations requiring quantitative comparisons.
-
Slide Structure
2-slide deck. Slide 1: Blue-series horizontal bars (Series 1 and Series 2) comparing 4 items (value 4 to 1). Slide 2: Orange-series bars with identical structure. Each bar includes numerical labels, 0–100% horizontal axis scale, and legend.
Related Products
-

Body Organ Analysis Subdivision Graph - Market and Competitor Comparison
#Market and Competitor Analysis #Graph #Competitor Analysis
-

VR Market Analysis Bar Graph – Understanding Competitive Landscape
#Market and Competitor Analysis #Graph #Competitor Analysis
-

Space Industry Market Analysis Bar Graph – Providing Strategic Insights
#Market and Competitor Analysis #Graph #Competitor Analysis
-

Blue Green Subdivided Graph – Template for Market and Competitor Analysis
#Market and Competitor Analysis #Graph #Competitor Analysis
