Global Network Analysis Graph – Ideal for Market and Competitor Analysis
RJ0400070_6
- Last Update 06/06/2025
- File Size 0.5MB
- # of Slides 2
- File Format PPTX
- Slide Ratio 16:9
- Color
Keywords
- #Content-Based Slides
- #Design-Based Slides
- #Market and Competitor Analysis
- #Graph
- #Competitor Analysis
- #Market Analysis
- #Horizontal Bar
- #Segmented Horizontal Bar
- #16:9
- #horizontal bar chart PowerPoint
- #year-over-year comparison slide
- #4-series bar graph template
- #market analysis chart PPT
- #competitor analysis PowerPoint slide
About the Product
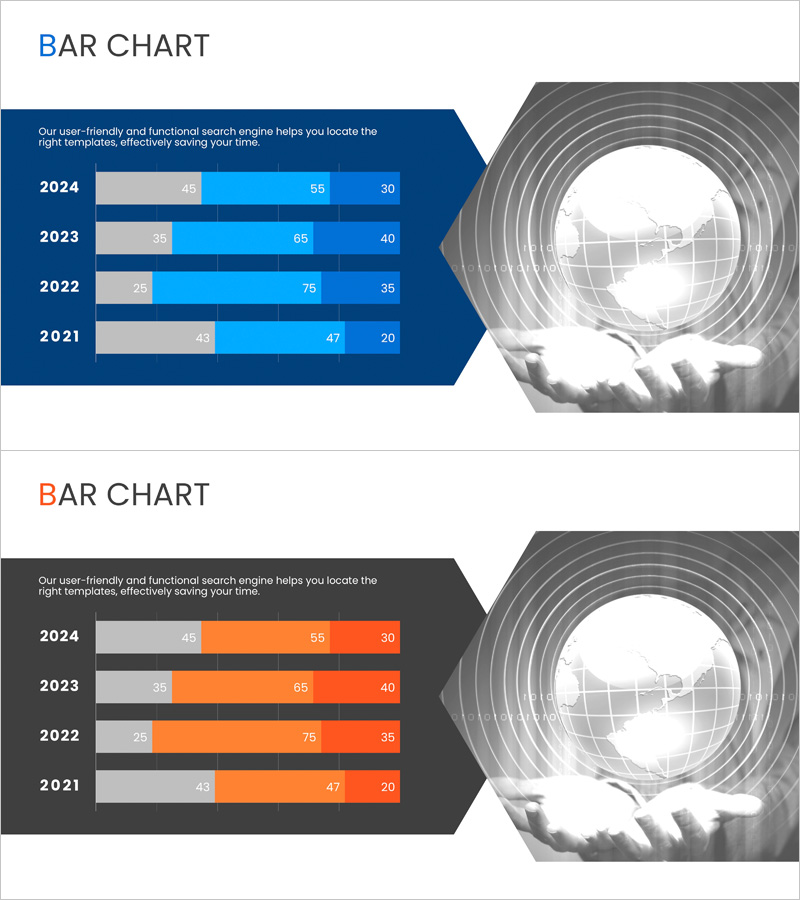
A horizontal bar chart PowerPoint slide comparing data across 4 years (2021–2024) with 3 data series. Set against a dark blue background with light blue, dark blue, and gray bars, this slide clearly visualizes numerical comparisons. Each year displays 3 metrics simultaneously, enabling effective visualization of time-series trends and cross-item performance gaps. Available in 16:9 PPTX format for immediate editing. Ideal for market analysis, competitor benchmarking, performance reporting, and strategic presentations.
Usage Points
-
Main Usage
This horizontal bar chart enables at-a-glance comparison of metrics across years and categories. By displaying 3 data series across 4 years simultaneously, it effectively visualizes time-series trends and performance differences. Ideal for presenting quantitative data such as market size, revenue, market share, customer satisfaction scores, and competitive positioning.
-
How to Use
Use this slide in business reports, marketing strategy presentations, and competitive analysis decks to compare year-over-year performance or benchmark against competitors. Simply replace the bar values with your own data and adjust colors to match your brand identity. Position it in the analysis or results section of your presentation to enhance audience comprehension of key metrics.
-
Recommended For
Executives, marketing managers, sales teams, consultants, and analysts use this slide for periodic reporting, strategic planning, and market research presentations. Particularly valuable when comparing year-over-year growth rates, market share, competitor metrics, or departmental performance. Suitable for B2B pitches, investor presentations, board meetings, and data-driven decision-making forums.
-
Slide Structure
2-slide set with dark blue background layout. Left side features a horizontal bar chart with 4 years (2024, 2023, 2022, 2021) and 3 color-coded series (gray, light blue, dark blue). Numerical values appear at the end of each bar. Right side displays a global network image. Optimized for 16:9 widescreen presentations.
Related Products
-

Horizontal Bar Graph Broken Down by Year – Optimal for Market and Competitor Analysis
#Market and Competitor Analysis #Graph #Competitor Analysis
-

Business Service Analysis Segmentation Graph – Ideal for Market and Competitor Analysis
#Market and Competitor Analysis #Graph #Competitor Analysis
-

Body Organ Analysis Subdivision Graph - Market and Competitor Comparison
#Market and Competitor Analysis #Graph #Competitor Analysis
-

Segmented Graph of Learning Goal Achievement – Market and Competitor Analysis
#Market and Competitor Analysis #Graph #Competitor Analysis
