Business Analysis Bar Graph for Competitor Analysis
RJ0400069_6
- Last Update 06/06/2025
- File Size 0.7MB
- # of Slides 2
- File Format PPTX
- Slide Ratio 16:9
- Color
Keywords
- #Content-Based Slides
- #Design-Based Slides
- #Market and Competitor Analysis
- #Graph
- #Competitor Analysis
- #Market Analysis
- #Column
- #Grouped Column
- #16:9
- #grouped bar chart PowerPoint
- #business analysis slide template
- #competitor analysis chart
- #market research graph
- #how to create bar chart in PowerPoint
- #data comparison presentation slide
About the Product
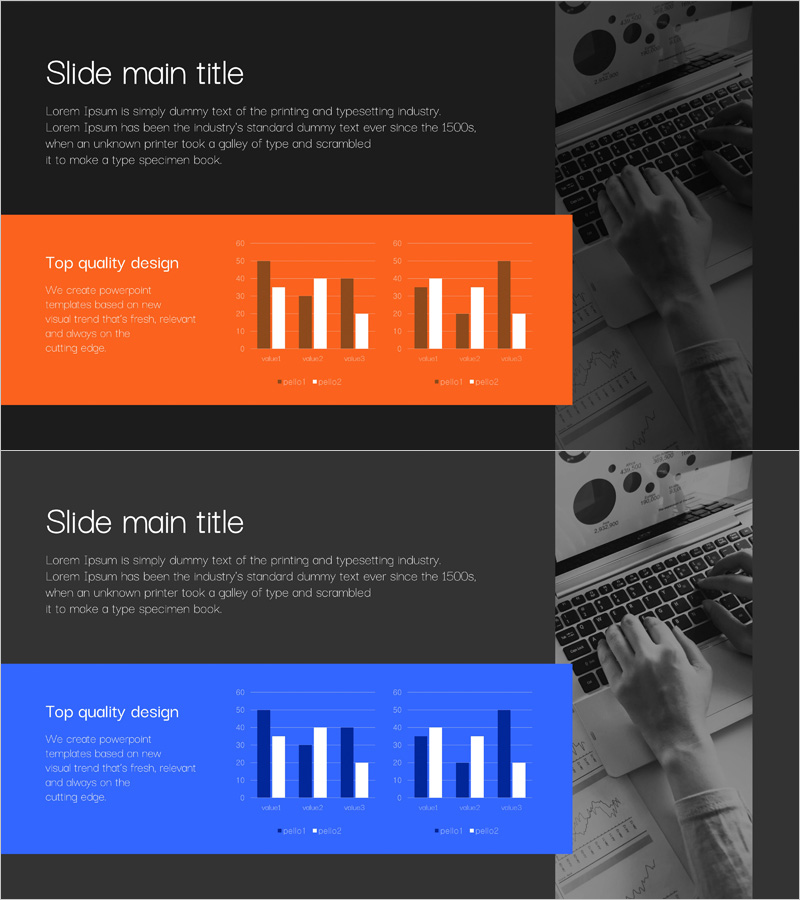
A business analysis bar chart PowerPoint slide designed for competitor analysis and market research presentations. This grouped bar chart features orange and blue color schemes, enabling simultaneous comparison of up to 6 data items across multiple series. Each slide uses distinct color coding by data series for intuitive information delivery, ready for immediate use in presentations and reports. The 16:9 widescreen format with 2-slide composition accommodates various analytical scenarios and business contexts.
Usage Points
-
Main Usage
Ideal for visualizing multi-series data in business analysis presentations such as competitor analysis, market research, and sales performance comparisons. The clear orange and blue color distinction enables effective simultaneous representation of two or more data series, facilitating comparative analysis communication.
-
How to Use
Replace the chart values with your own data using PowerPoint's chart editing tools. Bar heights and colors are fully editable through the native chart interface. Add or modify legends and axis labels for clarity, and adjust background colors and text formatting to match your presentation theme.
-
Recommended For
Marketing professionals, sales analysts, business executives, management consultants, and market research specialists presenting competitive analysis, sales performance reviews, and market share comparisons.
-
Slide Structure
Two-slide composition, each featuring a grouped bar chart with 6 data items. Orange and blue bars are positioned side-by-side for each category, enabling direct numerical comparison. Legends and axis scales are included to facilitate data interpretation and professional presentation.
Related Products
-

Vertical Bar Cluster Analysis Graph – Market and Competitor Analysis
#Market and Competitor Analysis #Graph #Competitor Analysis
-

Big Data Analysis Graph - An Effective Market Analysis Tool
#Market and Competitor Analysis #Graph #Competitor Analysis
-

Comparative Analysis of Vertical Bar Bundles
#Market and Competitor Analysis #Graph #Competitor Analysis
-

Clustered Vertical Bar Graph for Market Analysis – Data Insights
#Market and Competitor Analysis #Graph #Competitor Analysis
