Cybersecurity Service Development Status Analysis Chart
RJ0400069_26
- Last Update 06/06/2025
- File Size 0.2MB
- # of Slides 2
- File Format PPTX
- Slide Ratio 16:9
- Color
Keywords
- #Content-Based Slides
- #Design-Based Slides
- #Product/Service Introduction
- #Market and Competitor Analysis
- #Graph
- #Development Status
- #Market Share
- #Circles
- #Doughnut Chart
- #16:9
- #donut chart PowerPoint
- #pie chart slide template
- #ratio analysis chart
- #data visualization PowerPoint
- #donut graph design
- #how to create donut chart in PowerPoint
About the Product
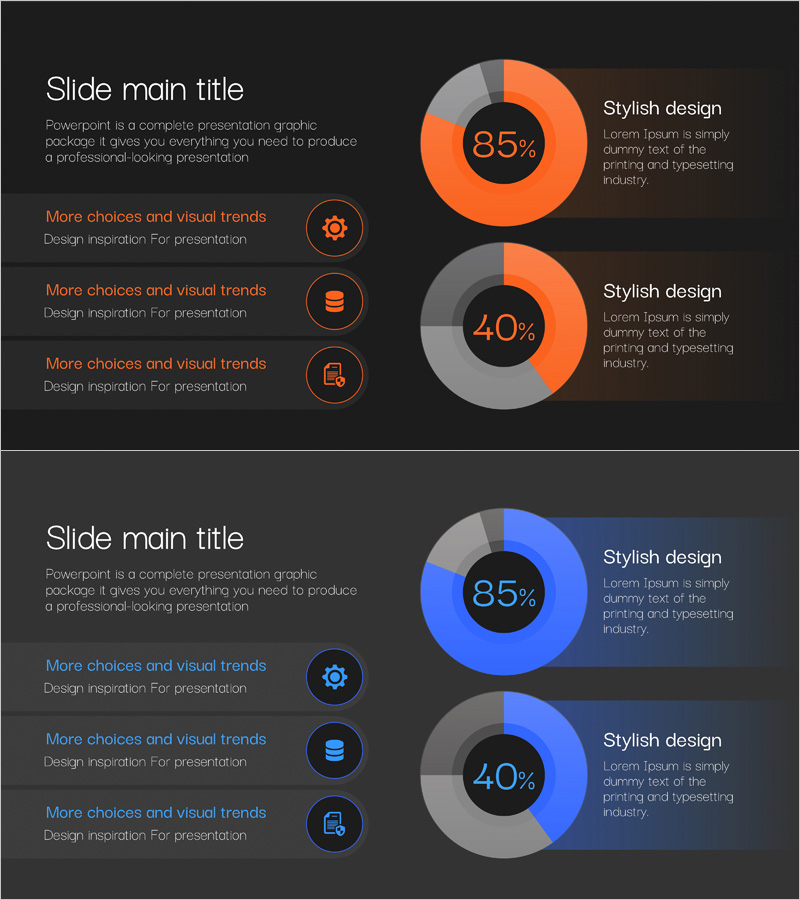
A donut chart PowerPoint slide template designed to visualize cybersecurity service development status and market analysis. This 2-slide set features dual-tone color schemes in orange and blue against a dark background, emphasizing key metrics like 85% and 40% in the center circle. The layout combines three icon elements on the left with donut-shaped pie charts on the right, creating a clear information hierarchy. Ideal for business presentations, service introductions, and data-driven reports that require immediate visual impact.
Usage Points
-
Main Usage
Visualizes development progress, market share, and performance metrics for cybersecurity and IT services using donut-shaped pie charts. The center circle highlights critical percentages (85%, 40%) to draw audience focus, while three left-side icons provide layered supporting information for comprehensive data storytelling.
-
How to Use
Insert into market analysis, performance report, or service introduction sections of your presentation. Replace chart percentages and labels with your actual data, and customize the three left-side icon descriptions to match your presentation topic. The 16:9 widescreen format ensures compatibility with modern presentation environments.
-
Recommended For
IT professionals, cybersecurity specialists, financial analysts, management consultants, marketing strategists, and investment pitch presenters. Suitable for any business presentation requiring intuitive visualization of quantitative data and percentage-based comparisons.
-
Slide Structure
2-slide layout with consistent design. Each slide positions title and descriptive text on the left alongside three circular-bordered icons, with a donut chart on the right. Charts feature two-segment divisions (gray and orange or blue), center-aligned percentage values, and full editability in PPTX format. 16:9 aspect ratio for widescreen displays.
Related Products
-

Analysis of Work Progress – Utilizing Pie Chart
#Product/Service Introduction #Market and Competitor Analysis #Graph
-

Analysis graph of market share progress
#Product/Service Introduction #Market and Competitor Analysis #Graph
-

City Theme Market Share Graph – Business Data Visualization
#Product/Service Introduction #Market and Competitor Analysis #Graph
-

Business Idea Development Status Graph – Ideas and Growth
#Product/Service Introduction #Market and Competitor Analysis #Graph
