Social Network Market Analysis Bar Chart
RJ0400068_8
- Last Update 06/06/2025
- File Size 7.3MB
- # of Slides 2
- File Format PPTX
- Slide Ratio 16:9
- Color
Keywords
About the Product
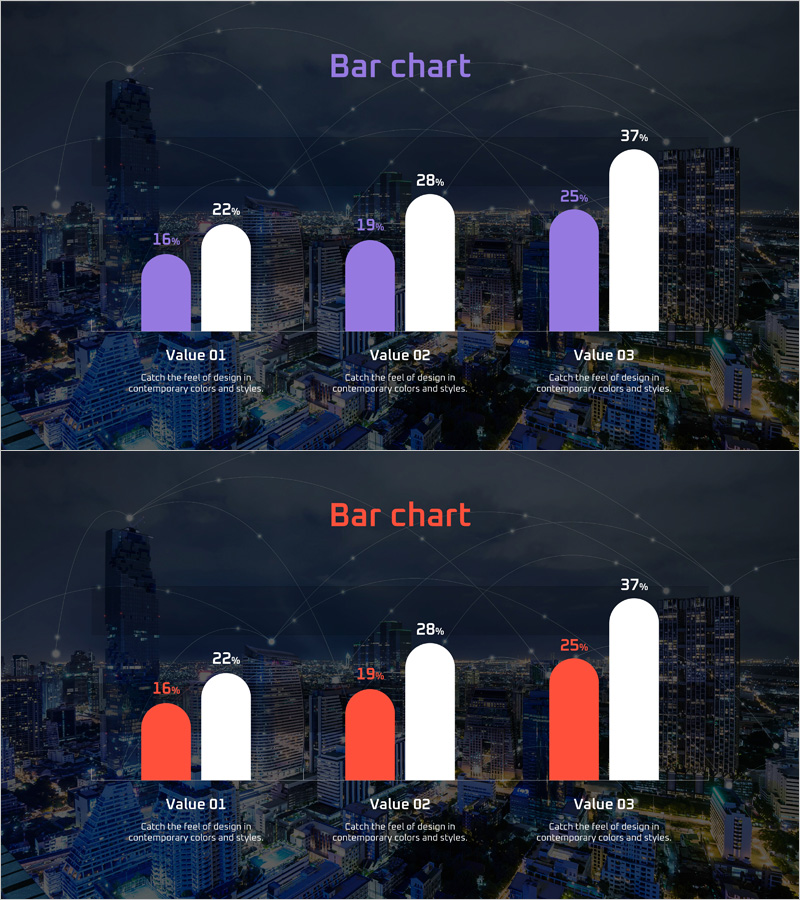
A grouped bar chart PowerPoint slide designed for social network market analysis and comparative data visualization. This template features three data items with dual-series bars (purple and white) arranged side-by-side to highlight contrasts and performance differences. The dark background with cityscape imagery reinforces professional business presentation aesthetics. Formatted in 16:9 widescreen with 2 slides, each bar displays percentage values at the top for enhanced data readability. Ideal for competitive analysis, market share comparison, performance metrics, and strategic business presentations requiring multi-item data comparison.
Usage Points
-
Main Usage
Visualizes comparative analysis of three data items across two metrics or categories using grouped bar representation. The dual-series structure (purple and white bars) enables clear contrast between competing values, while percentage labels provide quantitative evidence for business decisions in market analysis, competitive benchmarking, and performance reporting.
-
How to Use
Insert into business presentations, marketing strategy documents, market research reports, and executive dashboards where numerical comparison is required. Customize bar colors and values to match your dataset, then deploy immediately. The cityscape background design enhances corporate credibility and visual impact in professional settings.
-
Recommended For
Marketing managers, executives, management consultants, market analysts, sales teams, and business strategists preparing data-driven presentations. Particularly effective for competitive landscape analysis, performance benchmarking, market share demonstration, and strategic business case presentations.
-
Slide Structure
Slide 1: Three data items (Value 01–03) with purple and white dual-series bars; percentage labels (16%, 22%, 19%, 28%, 25%, 37%) positioned above each bar. Slide 2: Identical layout with red and white dual-series bars. Dark background with cityscape image, title area at top, descriptive text fields below each item.
Related Products
-

Clustered Vertical Bar Graph for Market Analysis – Data Insights
#Market and Competitor Analysis #Graph #Competitor Analysis
-

Comparative Analysis of Vertical Bar Bundles
#Market and Competitor Analysis #Graph #Competitor Analysis
-

Vertical Bar Cluster Analysis Graph – Market and Competitor Analysis
#Market and Competitor Analysis #Graph #Competitor Analysis
-

Paper Theme Table Chart & Bar Graph – Market Analysis and Competitive Strength
#Market and Competitor Analysis #Diagram #Graph
