Blue Yellow Development Status Circular Graph
RJ0400067_17
- Last Update 06/05/2025
- File Size 0.2MB
- # of Slides 2
- File Format PPTX
- Slide Ratio 16:9
- Color
Keywords
- #Content-Based Slides
- #Design-Based Slides
- #Product/Service Introduction
- #Market and Competitor Analysis
- #Graph
- #Development Status
- #Market Share
- #Circles
- #Doughnut Chart
- #16:9
- #donut chart PowerPoint slide
- #pie chart template
- #data visualization slide
- #market share presentation
- #development status chart
- #circular graph download
About the Product
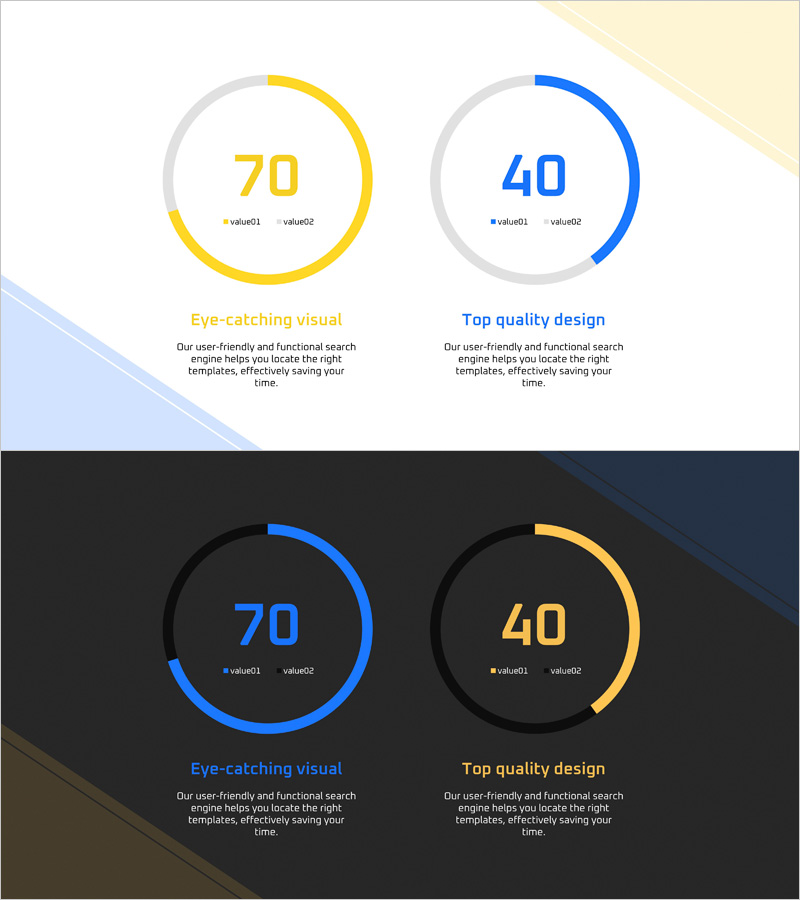
A professional donut chart PowerPoint slide designed to visualize development status and market share with dual-color emphasis. This 2-slide presentation template features blue and yellow accent colors, with large numerical values displayed at the center of each chart and legend labels for clear data comparison. Optimized for 16:9 widescreen format, it integrates seamlessly into business reports, presentations, and pitch decks where performance metrics or compositional ratios need prominent display. Fully editable PPTX format allows you to customize values, legend text, and colors to match your data and corporate branding.
Usage Points
-
Main Usage
Effectively communicate part-to-whole relationships such as development progress, market share distribution, budget allocation, and customer satisfaction metrics. The donut design emphasizes central numerical values to capture audience attention, while blue-yellow color contrast clearly differentiates between two data categories.
-
How to Use
Insert into performance analysis sections of quarterly reports, project status presentations, or investor pitch decks. Replace center values with your percentages or absolute figures, update legend labels and corresponding data points, and adjust colors to align with your corporate identity. All elements remain fully editable within PowerPoint.
-
Recommended For
Ideal for executives, business analysts, marketing managers, project leads, and financial professionals presenting quarterly results, market analysis, budget reviews, investor relations, and strategic planning sessions where data-driven insights require clear visual communication.
-
Slide Structure
Two-slide template with centered donut charts displaying prominent numerical values (70 and 40). Left slide features yellow accent color; right slide uses blue accent. Each chart includes legend entries (value01, value02) and descriptive text areas positioned below for comprehensive data labeling and context.
Related Products
-

Analysis graph of market share progress
#Product/Service Introduction #Market and Competitor Analysis #Graph
-

Financial Business Analysis Pie Chart – Market Share Insights
#Product/Service Introduction #Market and Competitor Analysis #Graph
-

Analysis of Transportation Usage Status – Pie Chart
#Product/Service Introduction #Market and Competitor Analysis #Graph
-

City Theme Market Share Graph – Business Data Visualization
#Product/Service Introduction #Market and Competitor Analysis #Graph
