Visualizing Company Service Development Status with Diagrams
RJ0300056_4
- Last Update 05/03/2025
- File Size 4.4MB
- # of Slides 2
- File Format PPTX
- Slide Ratio 16:9
- Color
Keywords
- #Content-Based Slides
- #Design-Based Slides
- #Company Introduction
- #Product/Service Introduction
- #Diagram
- #Graph
- #Company Overview
- #Development Status
- #Cluster
- #Circles
- #Chain Diagram
- #Doughnut Chart
- #16:9
- #donut chart PowerPoint slide
- #pie chart presentation template
- #percentage visualization diagram
- #donut graph slide design
- #service development status slide
About the Product
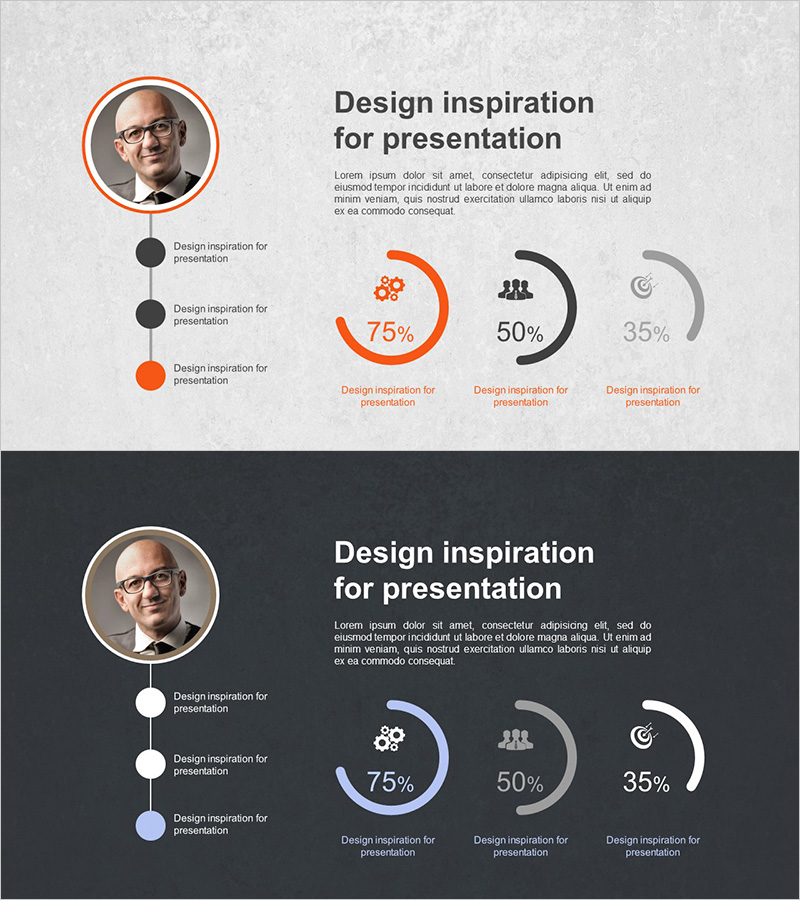
A PowerPoint slide template featuring donut-shaped pie charts to visualize service development status, marketing performance, and project completion rates. Three donut charts in orange, black, and gray display different percentages (75%, 50%, 35%) with corresponding icons and labels. A profile image and vertical timeline element are integrated into the layout, allowing you to present team member information alongside performance metrics. The 2-slide set includes both light and dark background versions for flexible presentation environments. Fully editable PPTX format ready for immediate customization.
Usage Points
-
Main Usage
Presents percentage-based data such as service development progress, marketing performance, project completion rates, and goal achievement through intuitive donut-shaped pie charts. The integrated profile section enables simultaneous presentation of team member information and performance indicators.
-
How to Use
Insert into performance reports, business status presentations, and marketing campaign results sections. Edit the percentage values and labels with your actual data for immediate use. Use the light background version for daytime meetings and client presentations; the dark background version suits evening events and premium-style presentations.
-
Recommended For
Marketing managers, project coordinators, business development teams, executives preparing status reports, and service planning teams needing to visualize performance metrics and progress. Ideal for startup pitch decks, quarterly performance reviews, client proposals, and situations requiring credible data visualization.
-
Slide Structure
2-slide layout featuring a circular profile image, left-aligned vertical timeline with 3 nodes, and three donut charts on the right (orange 75%, black 50%, gray 35%). First slide has light gray background; second slide features dark background for environment-specific selection.
Related Products
-

Work Progress Status Graph – Visualizing Current Project Status
#Product/Service Introduction #Operational Plan #Diagram
-

Competitive Advantage Analysis Diagram – Drive to Market Success
#Product/Service Introduction #Market and Competitor Analysis #Diagram
-

Development Status Donut Graph – Market Share Visualization
#Product/Service Introduction #Market and Competitor Analysis #Diagram
-

System Development Status Graph – Visualizing Market Share
#Product/Service Introduction #Market and Competitor Analysis #Diagram
