Smart Network Business Support Plan Template
RJ0400061_25
- Last Update 06/03/2025
- File Size 0.8MB
- # of Slides 2
- File Format PPTX
- Slide Ratio 16:9
- Color
Keywords
- #Content-Based Slides
- #Design-Based Slides
- #Operational Plan
- #Financial Plans and Performance
- #Diagram
- #Business Support Plan
- #Sales and Revenue
- #Cluster
- #Table
- #Combination Diagram
- #16:9
- #overlapping circle diagram PowerPoint
- #network relationship slide
- #two-node connection diagram
- #business structure PowerPoint slide
- #how to create network diagram in PowerPoint
About the Product
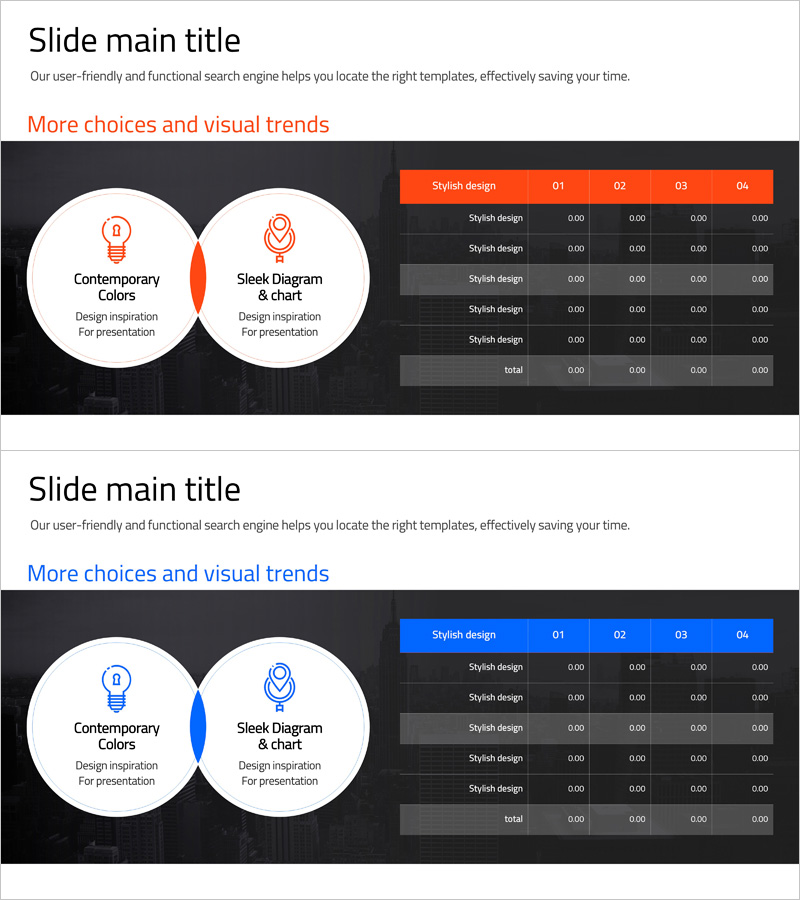
A PowerPoint slide featuring two overlapping circular nodes that visualize relationships and connections between concepts. Available in two color versions—orange and blue—with icons and text positioned within each circle to represent interaction between items. The central connecting element emphasizes the relationship between the two nodes, making it ideal for business support plans, network structures, partnership frameworks, and collaborative initiatives. Created in 16:9 widescreen format and fully editable in PPTX.
Usage Points
-
Main Usage
This slide effectively visualizes the relationship and interaction between two core concepts, departments, or entities. The overlapping circle structure simultaneously shows commonalities and differences, making it ideal for comparative analysis, network relationship mapping, and business linkage structure explanations.
-
How to Use
Replace the text and icons within each circle with your own content. Select either the orange or blue version to match your presentation theme and corporate branding. Modify the central connecting element's text to clearly express the relationship between the two items.
-
Recommended For
Recommended for presentations on business support strategies, strategic partnerships, inter-departmental collaboration frameworks, network structures, and supply chain relationships. Suitable for executive briefings, investor presentations, organizational restructuring announcements, and partnership introductions.
-
Slide Structure
Two identically sized circular nodes overlap at the center. Each circle contains an icon (lightbulb and necklace shapes), title, and descriptive text. A central connecting element in orange or blue emphasizes the relationship between nodes. A data table on the right side allows for numerical information display alongside the diagram.
Related Products
-

Idea Analysis Strategy Chart – The Foundation of Business Operations
#Operational Plan #Financial Plans and Performance #Diagram
-

Blue Pink Sales and Profit Table
#Financial Plans and Performance #Diagram #Capital Requirements
-

Capital Sales Analysis Graph – Visualizing Financial Performance
#Financial Plans and Performance #Diagram #Graph
-

Sales and Profit Diagram – Clear Financial Visualization
#Financial Plans and Performance #Diagram #Capital Requirements
