Income Reporting Table Chart - Emphasizing Financial Performance
RM0500003_25
- Last Update 02/20/2025
- File Size 2.7MB
- # of Slides 2
- File Format PPTX
- Slide Ratio 16:9
- Color
Keywords
About the Product
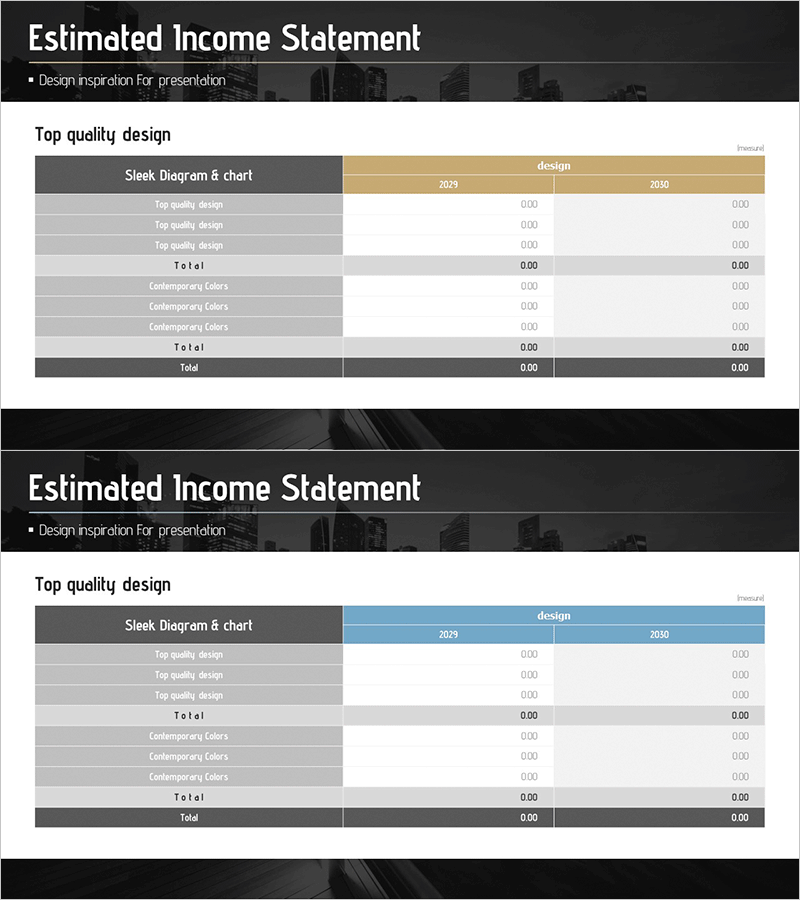
A professional income statement table PowerPoint slide designed to present financial performance with clarity and impact. This slide features a side-by-side comparison layout for 2023 and 2030 financial data, with a clear separation between row labels and numerical columns for optimal readability. The design uses a dark gray header and light gray row dividers to establish information hierarchy, complemented by a business-themed background image that reinforces financial credibility. This PPT slide is ready to use in financial reports, investor presentations, earnings statements, and quarterly performance reviews.
Usage Points
-
Main Usage
Present and compare financial performance metrics across multiple years in a structured table format. This slide enables clear visualization of revenue, expenses, and profit figures, supporting data-driven decision-making and demonstrating financial transparency to stakeholders and investors.
-
How to Use
Enter financial line items (revenue, expenses, net income, etc.) in the left column and corresponding year-over-year figures in the right columns. Header colors and row backgrounds can be customized to match corporate branding, and additional rows can be inserted to accommodate more financial categories.
-
Recommended For
CFOs and finance professionals presenting quarterly or annual results, investor relations presentations, bank loan applications, earnings announcements, financial analysis reports, and board-level financial reviews.
-
Slide Structure
Two-slide set featuring identical table structures with different header color schemes—beige tone on the first slide and blue tone on the second. Each slide contains 8 data rows plus 2 year columns, providing 16 editable data entry fields per slide for comprehensive financial reporting.
Related Products
-

Profit and Loss Statement Slide – Calculating Investment Business Sales and Profits
#Financial Plans and Performance #Diagram #Income Statement
-

Transportation Business Sales and Profit Table – Financial Analysis
#Financial Plans and Performance #Diagram #Income Statement
-

Affiliate Business Income Statement – Visualizing Financial Performance
#Financial Plans and Performance #Diagram #Income Statement
-

Sales and Profit Calculation Table – Key to Profit Management
#Financial Plans and Performance #Diagram #Income Statement
