Financial Planning Income Statement PowerPoint Template – A Clear View of Finances and Performance
RM0500005_25
- Last Update 02/21/2025
- File Size 0.2MB
- # of Slides 2
- File Format PPTX
- Slide Ratio 16:9
- Color
Keywords
- #Content-Based Slides
- #Design-Based Slides
- #Financial Plans and Performance
- #Diagram
- #Income Statement
- #Sales and Revenue
- #Table
- #16:9
- #income statement PowerPoint slide
- #financial data table design
- #how to present income statement in PowerPoint
- #financial performance presentation slide
- #investor IR financial slide
About the Product
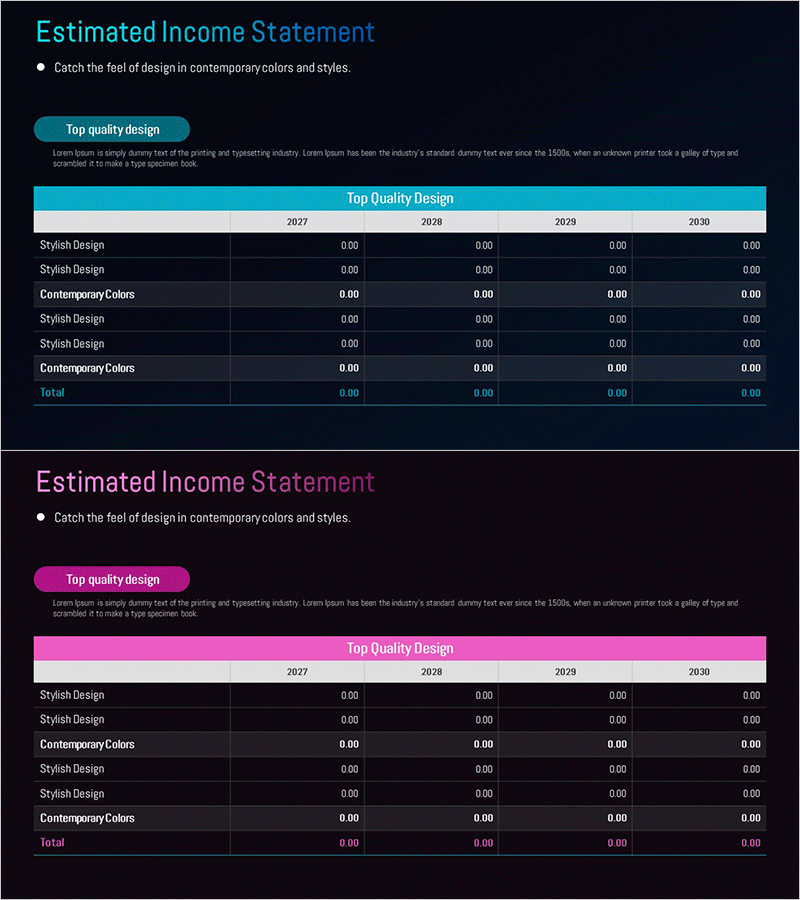
A professional income statement PowerPoint slide designed to present financial performance with clarity and impact. The teal header and dark background create strong visual contrast that emphasizes numerical data, while the year-over-year comparison structure (2027–2030) enables stakeholders to assess financial trends at a glance. The well-organized table layout with clear row and column separation makes it ideal for investor presentations, board meetings, and financial reporting. Available in 16:9 PPTX format, fully editable across all devices, this slide conveys corporate financial health and growth potential with credibility and professionalism.
Usage Points
-
Main Usage
Transforms income statement data into a visually compelling format that communicates financial performance transparently. The teal header and dark background maximize readability of numerical information, while the year-over-year comparison structure supports financial trend analysis. Ideal for investor relations materials, financial reports, executive briefings, and quarterly earnings presentations.
-
How to Use
Deploy this slide in investor presentations, board meetings, and financial team discussions to explain key metrics such as revenue, expenses, and net income. Replace placeholder figures with actual financial data and apply accent colors to highlight critical line items. The two-slide set offers both teal and magenta color options, allowing you to align with corporate branding guidelines.
-
Recommended For
CFOs, financial controllers, investor relations managers, executives, and finance teams presenting financial results. Suitable for quarterly earnings calls, investment pitch decks, M&A negotiations, bank loan applications, and any scenario where financial credibility and data-driven communication are essential.
-
Slide Structure
Each slide features a title area, descriptive text box, and a 7-row by 5-column financial data table. The header row displays fiscal years (2027–2030), while the left column lists line items (Stylish Design, Contemporary Colors, etc.). All data cells are fully editable, and color themes are available in teal or magenta to match your presentation style.
Related Products
-

Sales and Profit Calculation Table – Key to Profit Management
#Financial Plans and Performance #Diagram #Income Statement
-

Sales and Profit Table – Clear Visualization of Financial Planning
#Financial Plans and Performance #Diagram #Other
-

Internet Shopping Sales and Profit Calculation Chart – Your Business Success Guide
#Financial Plans and Performance #Diagram #Graph
-

Profit and Loss Statement Slide – Calculating Investment Business Sales and Profits
#Financial Plans and Performance #Diagram #Income Statement
