Line Graph for Comparative Analysis
RJ0400061_23
- Last Update 06/03/2025
- File Size 0.3MB
- # of Slides 2
- File Format PPTX
- Slide Ratio 16:9
- Color
Keywords
- #Content-Based Slides
- #Design-Based Slides
- #Market and Competitor Analysis
- #Graph
- #Competitor Analysis
- #Competitive Advantage
- #16:9
- #line graph PowerPoint slide
- #comparative analysis chart
- #market analysis PowerPoint
- #competitive comparison slide
- #data visualization PPT
- #how to create line charts in PowerPoint
About the Product
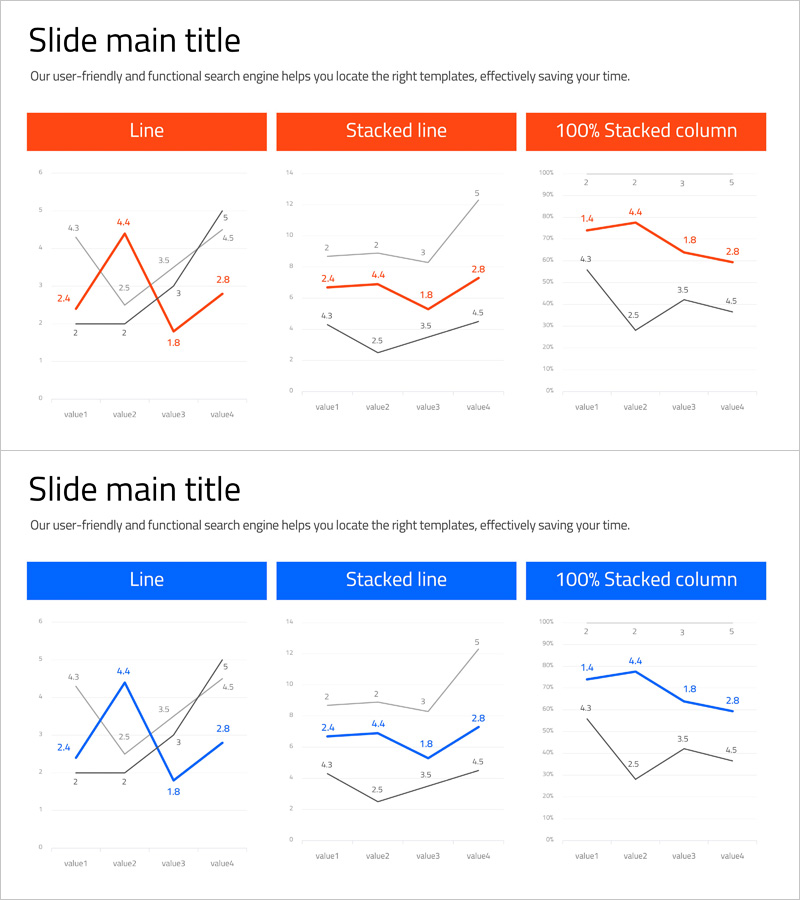
A comprehensive line graph PowerPoint slide designed for market analysis and competitive comparison. This presentation template features three distinct chart types—standard line chart, stacked line chart, and 100% stacked column chart—displayed in a single slide layout for versatile data visualization. Available in two color schemes (orange and blue), each chart includes four data points with numerical labels for precise comparative analysis. Ideal for investor presentations, business reports, and marketing strategy briefings to effectively communicate competitive advantages and market trends.
Usage Points
-
Main Usage
Visualize multiple data series simultaneously to compare competitor performance, market share trends, and revenue growth patterns. Line chart intersections and slopes reveal competitive advantage shifts intuitively, while stacked charts display both total scale and compositional ratios for comprehensive market understanding.
-
How to Use
Use in investor presentations to highlight growth rate advantages over competitors, in business reports' market analysis sections to explain market dynamics, and in marketing strategy presentations to demonstrate target market size evolution. Clear legends and axis labels ensure audience comprehension without additional explanation.
-
Recommended For
Finance professionals, marketing strategists, executives, management consultants, and business analysts requiring data-driven decision support. Essential for competitive analysis, market research, financial performance reporting, and business strategy development phases.
-
Slide Structure
Title and descriptive text area at the top, followed by three independent chart sections below. Each chart has its own heading (Line, Stacked line, 100% Stacked column) with four data points and numerical labels. Y-axis scales on the left and X-axis category names are clearly marked for easy interpretation.
Related Products
-

Triangle Pattern Wide PowerPoint Template – Horizontal Bar Chart
#Market and Competitor Analysis #Graph #Competitor Analysis
-

Business Competitor Analysis Graph
#Market and Competitor Analysis #Graph #Competitor Analysis
-

Competitor Analysis Graph & Table by Year
#Market and Competitor Analysis #Diagram #Graph
-

Comparative Analysis Line Graph – Market & Competitor Analysis
#Market and Competitor Analysis #Graph #Competitor Analysis
