Competitor Comparison Analysis Radial Graph
RM0500007_13
- Last Update 02/21/2025
- File Size 2.3MB
- # of Slides 2
- File Format PPTX
- Slide Ratio 16:9
- Color
Keywords
- #Content-Based Slides
- #Design-Based Slides
- #Market and Competitor Analysis
- #Diagram
- #Graph
- #Competitor Analysis
- #Competitive Advantage
- #Other
- #Radar Chart Spider Chart
- #16:9
- #radial graph PowerPoint
- #competitor comparison analysis slide
- #5-axis diagram template
- #competitive analysis chart
- #radial diagram PowerPoint template
About the Product
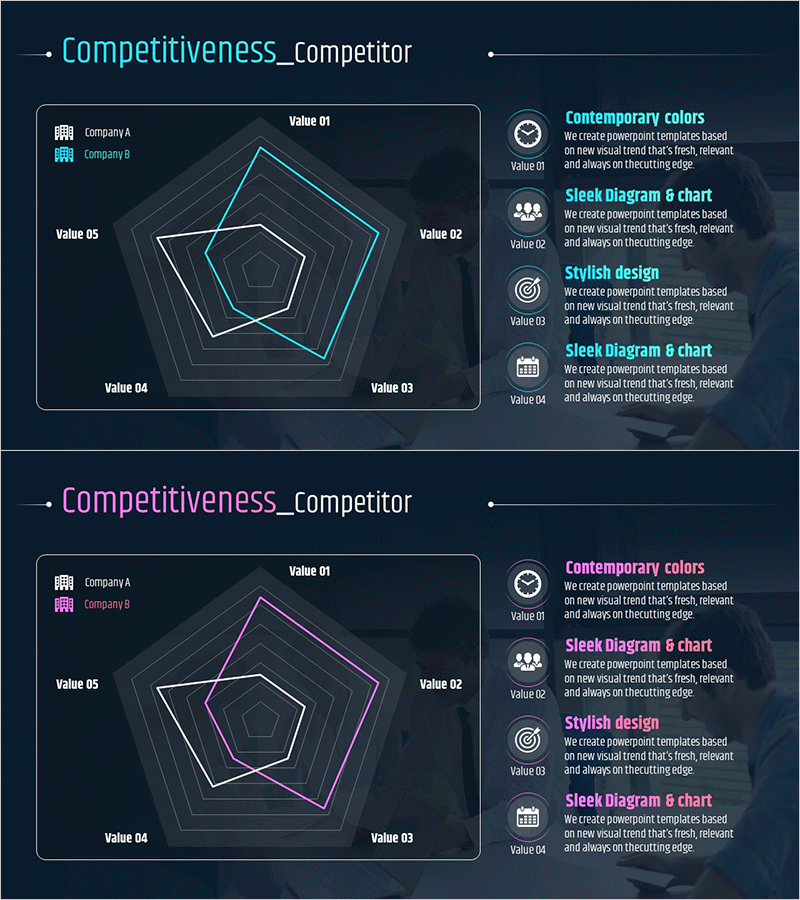
A 5-axis radial graph PowerPoint slide designed for competitor comparison and competitive analysis. Built on a dark navy background with cyan blue accent lines forming a pentagon structure, this slide enables simultaneous visualization of up to two companies' performance metrics across five key dimensions. Each axis is labeled Value 01 through Value 05, allowing you to input diverse evaluation criteria such as pricing, quality, technology, market share, and customer satisfaction. The legend clearly distinguishes Company A and Company B, making comparative analysis intuitive and data-driven. Two-slide set includes both cyan and magenta color versions to match your presentation tone. Fully editable PPTX format for immediate customization.
Usage Points
-
Main Usage
This radial graph is engineered to reveal your company's competitive strengths and weaknesses at a glance. The five evaluation axes enable quantitative comparison across critical metrics—pricing, quality, technology, market share, and customer satisfaction—while overlaying two companies' data to communicate differences intuitively and persuasively.
-
How to Use
Deploy this slide in strategic planning sessions during competitive landscape analysis, or in investor presentations when explaining market positioning. Edit the Value labels and Company names to input actual data, then adjust line colors and transparency to emphasize key differentiators and strengthen visual impact.
-
Recommended For
Strategic planning teams, marketing professionals, and business development executives presenting competitive analysis findings. Particularly effective for new market entry evaluations, product positioning strategy development, and investor relations materials where clear competitive differentiation is essential.
-
Slide Structure
Pentagon-shaped 5-axis radial graph with five axes (Value 01–05) radiating from center outward. Two overlapping polygonal lines represent Company A (cyan) and Company B (magenta), with a legend on the left clearly distinguishing both entities. Right side features an icon-supported text area highlighting slide characteristics: Contemporary colors, Sleek Diagram & chart, and Stylish design.
Related Products
-

Brain Data Analysis Radial Graph – Insights on Technology and Market
#Market and Competitor Analysis #Diagram #Graph
-

Competitor Comparison Graph & Table - Essential Tool for Market Analysis
#Market and Competitor Analysis #Diagram #Competitor Analysis
-

Card Competitor Comparison Slide Template – Competitive Advantage Analysis
#Market and Competitor Analysis #Diagram #Competitor Analysis
-

Visualizing Market Trends with Musician Comparison Graphs
#Market and Competitor Analysis #Diagram #Graph
