Competitive Advantage Analysis Line Graph
RJ0400036_18
- Last Update 05/27/2025
- File Size 0.3MB
- # of Slides 2
- File Format PPTX
- Slide Ratio 16:9
- Color
Keywords
About the Product
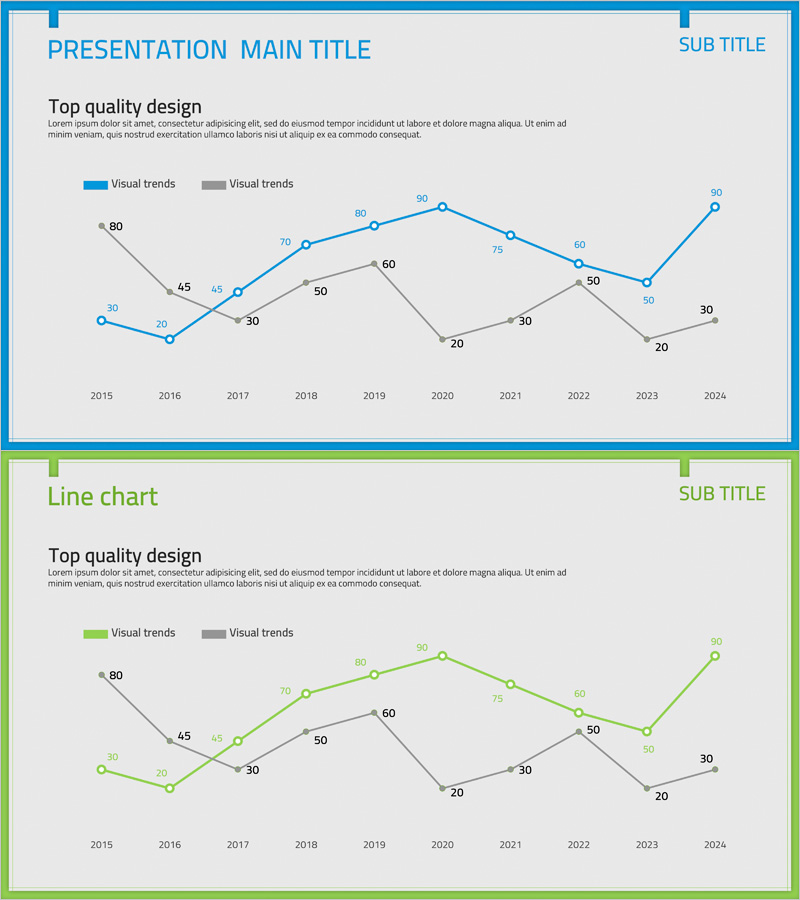
A dual-series line chart PowerPoint slide that visualizes competitive positioning over a 10-year period from 2015 to 2024. The slide features blue and gray trend lines with clearly marked data points for each year, enabling quick comparison of competitive advantage metrics across time. This presentation slide is ideal for business strategy reports, market analysis presentations, and investor pitches where demonstrating competitive positioning is critical. The 16:9 widescreen format includes 2 slides with fully editable elements, allowing you to customize data values, axis labels, and legend text to match your specific competitive analysis.
Usage Points
-
Main Usage
Demonstrates competitive positioning by tracking how your organization's advantage metrics change relative to competitors over time. The dual-line format allows side-by-side comparison of two competing indicators, making it ideal for illustrating market share trends, performance benchmarks, or strategic advantage evolution.
-
How to Use
Insert this slide into strategy presentations, board meetings, or investor decks when discussing competitive landscape analysis. Replace the sample data points with your actual metrics, update the legend labels to reflect your specific competitive factors (e.g., market share, customer satisfaction, price competitiveness), and adjust the axis titles as needed.
-
Recommended For
Business strategists, marketing directors, product managers, and executives presenting competitive analysis to stakeholders, investors, or internal teams. Perfect for annual strategy reviews, market entry presentations, competitive intelligence reports, and long-term business planning sessions.
-
Slide Structure
Two-slide set with identical chart structure but different accent colors (blue series and green series emphasis). Each slide contains a dual-line chart with 10 data points spanning 2015–2024, labeled axes, legend area, title and subtitle placeholders, and is formatted in 16:9 widescreen ratio for modern presentation displays.
Related Products
-

Variation Graph for the Line Chart – Optimized Design for Market and Competitor Analysis
#Market and Competitor Analysis #Graph #Competitor Analysis
-

Competition Graphs and Analysis – Slides for Market Advantage
#Market and Competitor Analysis #Graph #Competitor Analysis
-

Competitor Analysis Broken Line Graph – Market Dominance and Competitive Advantage
#Market and Competitor Analysis #Graph #Competitor Analysis
-

Competitor Comparison Analysis Graph - Highlighting Competitive Advantage
#Market and Competitor Analysis #Graph #Competitor Analysis
