Analysis Vertical Bar Graph – Market Competitiveness Visualization
RJ0400061_20
- Last Update 06/03/2025
- File Size 0.3MB
- # of Slides 2
- File Format PPTX
- Slide Ratio 16:9
- Color
Keywords
About the Product
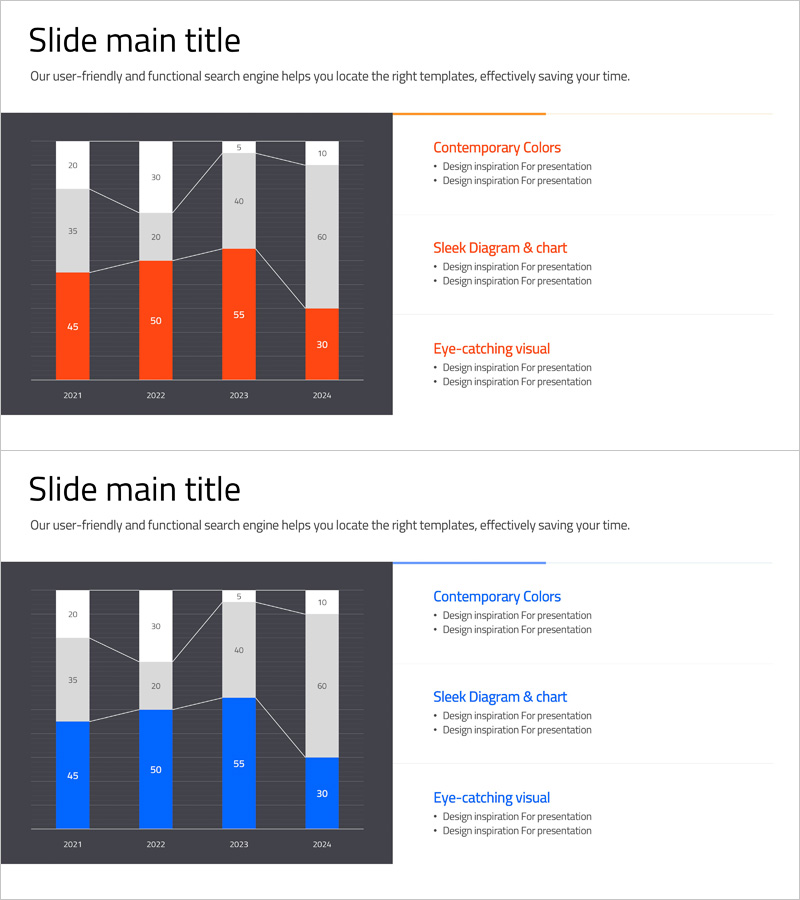
A vertical bar chart PowerPoint slide that visualizes data changes across four years from 2021 to 2024. Designed with a dark background and orange and gray color bars, it is optimized for year-over-year comparisons and trend analysis. An overlaid line graph simultaneously displays the overall trajectory, making it suitable for various presentations including market competitiveness, sales performance, and achievement comparisons. The 2-slide set includes both orange and blue versions, allowing you to select the version that matches your presentation tone.
Usage Points
-
Main Usage
Clearly visualizes numerical comparisons and change trends across years and categories. Bar heights represent absolute values while the overlaid line shows overall flow, making it effective for decision-making materials.
-
How to Use
Use in business reports for performance analysis sections, marketing plans for market situation analysis, investor pitch decks for revenue trend explanations, and executive briefing materials for KPI comparisons. Directly edit values for immediate customization.
-
Recommended For
Finance professionals, marketing teams, business analysts, sales managers, and consultants who need to communicate quantitative data persuasively. Particularly useful for quarterly and annual performance presentations and competitive analysis.
-
Slide Structure
Left side features a dark charcoal background with four sets of vertical bars representing five data points for each year (2021–2024). Each bar is distinguished by orange (or blue) accent color and gray supporting color. A line graph at the top expresses overall trend. Right side includes a text description area for three key insights.
Related Products
-

Visualizing Bar Graphs with PC Mockups – Competitive Market Analysis Tool
#Market and Competitor Analysis #Graph #Other
-

Subdivided Bar Graph for Visual Market Analysis – Presenting Competitive Data Effectively
#Market and Competitor Analysis #Diagram #Graph
-

Monthly Analysis Graph of Banking Services Sector – Market and Competitor Analysis
#Market and Competitor Analysis #Financial Plans and Performance #Graph
-

Analysis of Courier Brand Usage Status – Insights on Competitors
#Market and Competitor Analysis #Graph #Competitor Analysis
