Analysis of Courier Brand Usage Status – Insights on Competitors
RJ0400046_15
- Last Update 10/27/2025
- File Size 0.5MB
- # of Slides 2
- File Format PPTX
- Slide Ratio 16:9
- Color
Keywords
- #Content-Based Slides
- #Design-Based Slides
- #Market and Competitor Analysis
- #Graph
- #Competitor Analysis
- #Market Analysis
- #Column
- #Segmented Column
- #16:9
- #3D stacked cylinder chart PowerPoint
- #4-layer data visualization slide
- #competitor analysis presentation
- #brand usage status PPT
- #market share comparison slide
- #logistics industry PowerPoint template
About the Product
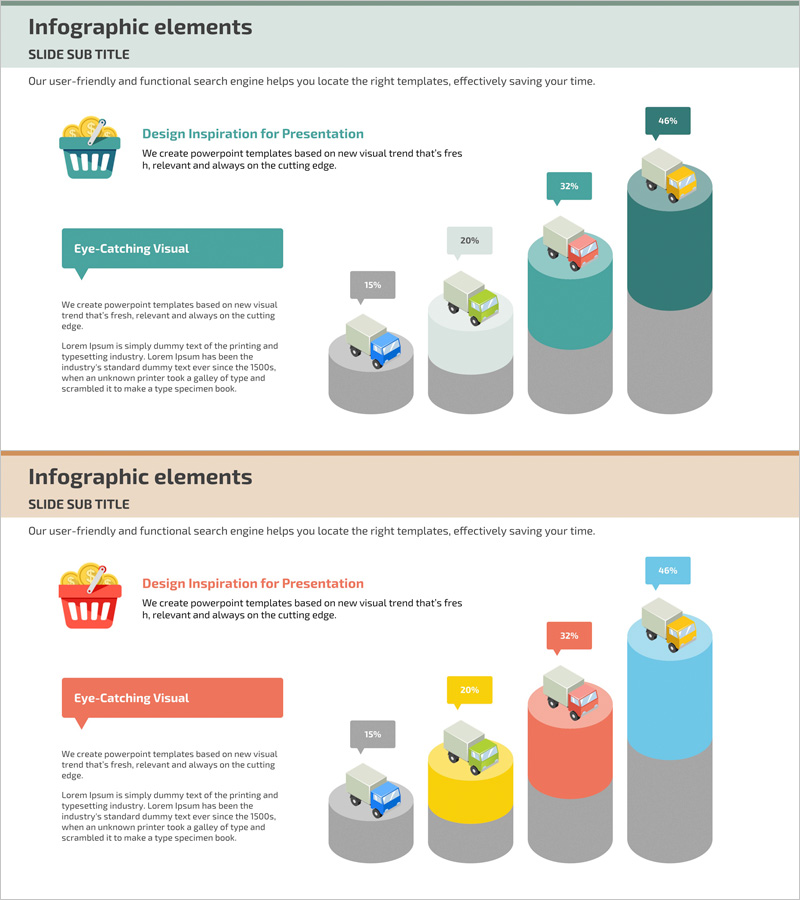
A 3D stacked cylinder chart PowerPoint slide that visualizes four-layer data with precision. Each tier displays percentage or comparative metrics using callout text boxes, making it ideal for competitor analysis, brand usage status, and market share comparison. The teal and coral color scheme highlights key indicators, while delivery truck icons and supporting illustrations enhance logistics and distribution industry presentations. Ready to use in 16:9 widescreen format with 2 slides in PPTX.
Usage Points
-
Main Usage
Presents multi-layer data such as competitor analysis, brand usage patterns, market share distribution, and customer preference surveys for logistics and courier companies. The stacked cylinder structure enables clear tier-by-tier comparison, supporting data-driven decision-making and stakeholder communication.
-
How to Use
Input four data points into the 3D stacked cylinder structure and add corresponding percentages or descriptions in the callout text boxes. Maintain the teal-coral color palette or customize to match corporate branding. Edit icons and truck illustrations to reflect your industry context or messaging.
-
Recommended For
Executive reports for logistics, courier, and distribution companies; marketing team presentations on competitive positioning; consulting firm market research findings; investor pitches on business performance and market dynamics. Ideal when comparing brand preference, customer usage patterns, or market penetration across multiple segments.
-
Slide Structure
Slide 1: Title area + 3D stacked cylinder chart (4 tiers) + 4 callout text boxes (percentage labels) + delivery truck icons. Slide 2: Alternate color variation (teal emphasis) with identical layout. Each layer is independently editable with clearly defined data entry zones.
Related Products
-

SEO System Analysis Graph – Understanding Market and Competitors
#Market and Competitor Analysis #Graph #Competitor Analysis
-

Vertical Bar Graph for Sector Analysis – Optimizing Data Visualization
#Market and Competitor Analysis #Graph #Competitor Analysis
-

Analysis Vertical Bar Graph – Market Competitiveness Visualization
#Market and Competitor Analysis #Graph #Competitor Analysis
-

Visualizing Bar Graphs with PC Mockups – Competitive Market Analysis Tool
#Market and Competitor Analysis #Graph #Other
