Target Market Share Analysis Graph – Strategic Market Insights
RJ0400061_19
- Last Update 06/03/2025
- File Size 0.4MB
- # of Slides 2
- File Format PPTX
- Slide Ratio 16:9
- Color
Keywords
- #Content-Based Slides
- #Design-Based Slides
- #Market and Competitor Analysis
- #Graph
- #Other
- #Market Analysis
- #Target Market
- #16:9
- #target market share analysis PowerPoint
- #market comparison slide
- #regional market data visualization
- #how to present market share in PowerPoint
- #business analysis presentation slide
About the Product
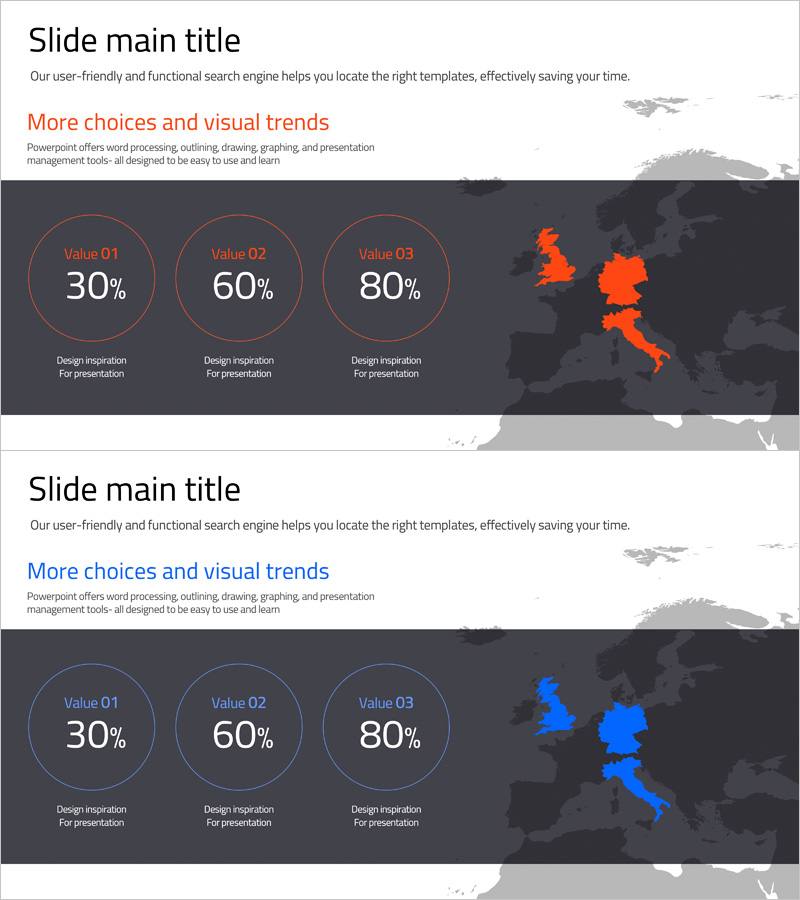
A PowerPoint slide that compares target market share across three regions using visual data representation. Circular charts display key metrics (30%, 60%, 80%) with corresponding regions highlighted on a world map, enabling quick market assessment at a glance. The dark background with orange and blue accent colors enhances data readability and contrast. This slide is ready to insert into presentations for investor pitches, strategy meetings, market analysis reports, and competitive positioning discussions. Fully editable text fields allow customization of region names, percentages, and descriptions.
Usage Points
-
Main Usage
This slide is designed to present target market share analysis by region, helping decision-makers understand market distribution and competitive positioning. The combination of pie charts and geographic visualization transforms complex market data into an intuitive, impactful presentation format.
-
How to Use
Use this slide in investor pitches, executive briefings, market analysis seminars, and business strategy meetings to explain regional market share distribution. Simply edit the chart percentages, region names, and descriptive text to match your actual market data for immediate deployment.
-
Recommended For
Marketing managers, business development teams, executives, investor relations professionals, and market analysts presenting market conditions or developing regional expansion strategies. Particularly valuable for multinational corporations and organizations planning geographic growth.
-
Slide Structure
The slide features a title and description area at the top, three pie charts (Value 01–03) on the left-center showing regional market share percentages, and a world map on the right with highlighted regions. Four editable text fields (title, description, and three chart labels) allow quick customization.
Related Products
-

Global Target Market Analysis Graph
#Market and Competitor Analysis #Diagram #Graph
-

Target Market Share Analysis Graph - Outstanding Business Insights
#Market and Competitor Analysis #Graph #Other
-

Horizontal Bar Chart Visualizing US Target Market Progress
#Market and Competitor Analysis #Graph #Other
-

Target Country Year-by-Year Analysis Chart – Data Visualization for Market Analysis
#Market and Competitor Analysis #Graph #Other
