Data Analysis Segmented Bar Graph – Technology Status and Analysis
RJ0400060_22
- Last Update 06/03/2025
- File Size 0.3MB
- # of Slides 2
- File Format PPTX
- Slide Ratio 16:9
- Color
Keywords
- #Content-Based Slides
- #Design-Based Slides
- #Product/Service Introduction
- #Business Introduction
- #Graph
- #Development Status
- #Technological Status
- #Horizontal Bar
- #Segmented Horizontal Bar
- #16:9
- #segmented bar chart PowerPoint
- #horizontal bar graph template
- #data analysis slide
- #technology status chart
- #multi-series bar graph PowerPoint slide
About the Product
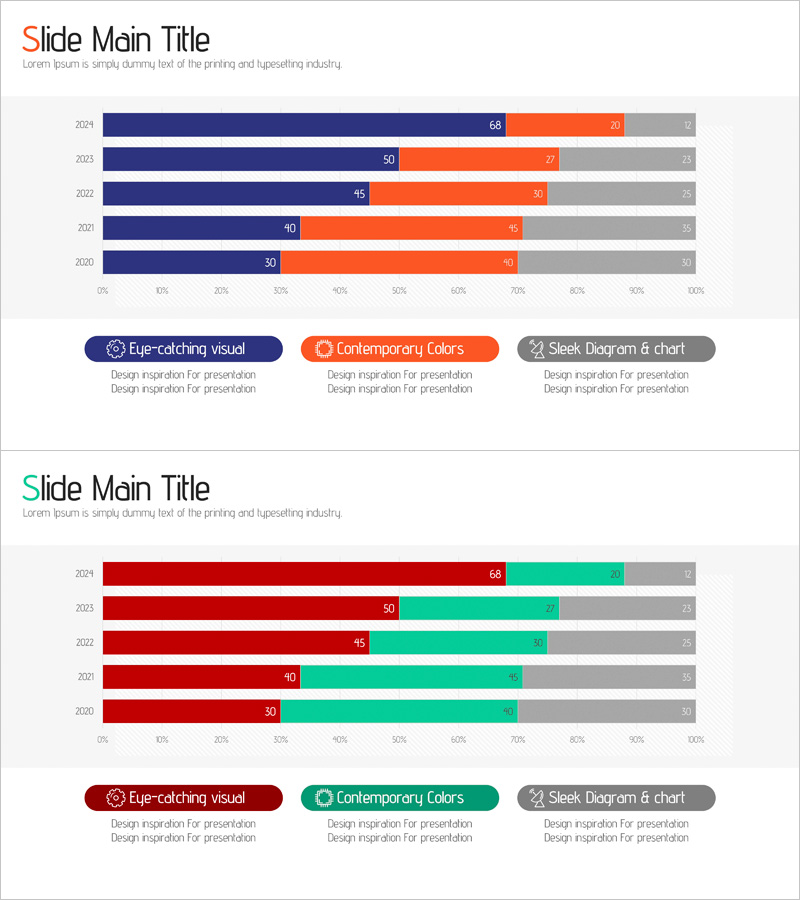
A segmented bar chart PowerPoint slide designed to visualize technology status and analytical data across multiple dimensions. The horizontal bar chart features navy, orange, and gray color schemes representing three data series across five years (2020–2024), with clear numerical labels for each segment. This presentation slide is optimized for comparative analysis of year-over-year trends and multi-category performance metrics. Fully editable in PowerPoint format, allowing quick customization of data values while maintaining professional chart design and visual hierarchy.
Usage Points
-
Main Usage
Presents complex multi-dimensional data such as technology trends, market analysis, and competitive benchmarking by comparing multiple data series across time periods. The segmented structure clearly differentiates three or more data categories, enabling audiences to understand both individual series performance and overall trends simultaneously.
-
How to Use
Ideal for business reports, technology trend presentations, marketing analysis decks, investor pitch meetings, and quarterly performance reviews. Pre-formatted with numerical labels and legend, requiring only data value updates for immediate deployment in professional presentations.
-
Recommended For
Technology teams, marketing departments, executives, data analysts, management consultants, and business intelligence professionals. Particularly suited for scenarios requiring simultaneous explanation of year-over-year changes and multi-category performance metrics.
-
Slide Structure
Two-slide set featuring identical segmented bar chart layouts with alternative color palettes. First slide uses navy, orange, and gray; second slide presents wine, mint, and gray color combinations. Both include title area, legend, numerical labels, and are optimized for 16:9 widescreen format with professional spacing and alignment.
Related Products
-

Global Business Development Status Graph – Vision for Expansion
#Product/Service Introduction #Business Introduction #Graph
-

Business Plan Presentation Template Pie Diagram – Effective Project Introduction
#Product/Service Introduction #Business Introduction #Graph
-

Manufacturing Analysis Graph – Market and Competitive Analysis
#Product/Service Introduction #Market and Competitor Analysis #Graph
-

Architectural Illustration Gauge Chart – Visualizing Technical Status
#Product/Service Introduction #Business Introduction #Graph
