Profit Settlement Statement – Essential for Income Statement
RJ0400060_18
- Last Update 06/03/2025
- File Size 0.3MB
- # of Slides 2
- File Format PPTX
- Slide Ratio 16:9
- Color
Keywords
- #Content-Based Slides
- #Design-Based Slides
- #Financial Plans and Performance
- #Diagram
- #Income Statement
- #Sales and Revenue
- #Table
- #16:9
- #income statement PPT slide
- #financial data table PowerPoint
- #profit and loss statement slide
- #revenue settlement table
- #how to create income statement in PowerPoint
About the Product
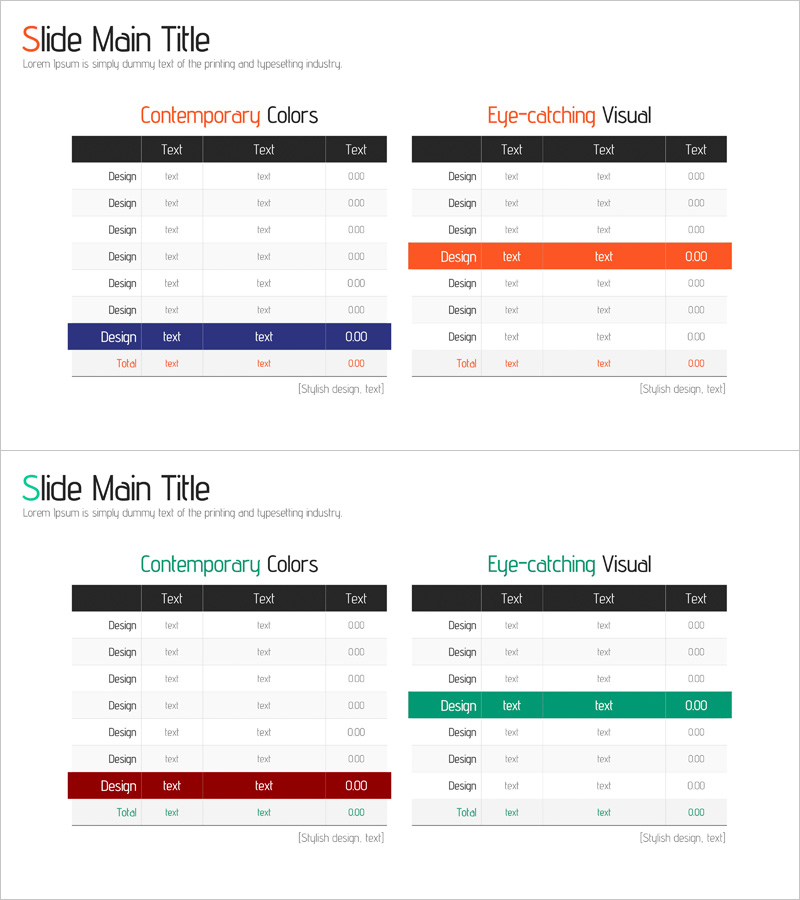
An essential financial data table PowerPoint slide set for income statements, financial reports, and investor presentations. This 2-slide deck features a black header row with orange and navy blue accent rows, designed to clearly visualize revenue, expenses, and net income figures. Two design variations are provided: the left version displays all data uniformly with contemporary color styling, while the right version emphasizes key metrics with eye-catching accent rows. Delivered in 16:9 widescreen PPTX format with clearly defined data entry fields for seamless financial figure input and immediate editing.
Usage Points
-
Main Usage
Designed to present income statement figures clearly in financial reports, business plans, and investor presentations. The black header and color-coded accent rows visually emphasize key financial metrics (revenue, expenses, net income), enabling effective communication of financial performance to investors, executives, and stakeholders.
-
How to Use
Simply input your actual financial figures into the table cells provided on each slide. Use the left version when presenting comprehensive financial data across all rows; select the right version when you need to highlight a specific metric such as net income. Colors and fonts can be freely customized to match your presentation brand guidelines.
-
Recommended For
CFOs, finance managers, and executives presenting quarterly earnings, financial results, and investor relations meetings. Also suitable for business proposals and new venture pitches where financial projections need clear tabular representation.
-
Slide Structure
Two-slide set, each featuring a 3-4 column table (Item, Amount, Change Rate) with 6-8 rows for financial line items (Revenue, Cost of Goods Sold, Operating Expenses, Operating Income, Taxes, Net Income, etc.). Header row in black, data rows in white, summary and emphasis rows in orange or navy blue for clear information hierarchy.
Related Products
-

Sales and Profit Table Diagram
#Financial Plans and Performance #Diagram #Income Statement
-

Sales and Profit Calculation Table – Key to Profit Management
#Financial Plans and Performance #Diagram #Income Statement
-

Sales and Profit Table – Financial Performance Visualization
#Financial Plans and Performance #Diagram #Income Statement
-

Sales and Profit Comparison Graph & Table – Clear Financial Analysis
#Financial Plans and Performance #Diagram #Graph
