Market Trend Analysis Graph – Sleek and Stylish Design
RJ0400060_14
- Last Update 06/03/2025
- File Size 2.2MB
- # of Slides 2
- File Format PPTX
- Slide Ratio 16:9
- Color
Keywords
- #Content-Based Slides
- #Design-Based Slides
- #Market and Competitor Analysis
- #Diagram
- #Graph
- #Market Status
- #Industry Trends
- #Table
- #Line
- #Standard Table
- #Line Chart
- #16:9
- #line chart PowerPoint slide
- #market trend analysis presentation
- #data visualization PPT
- #business graph template
- #how to create line chart in PowerPoint
About the Product
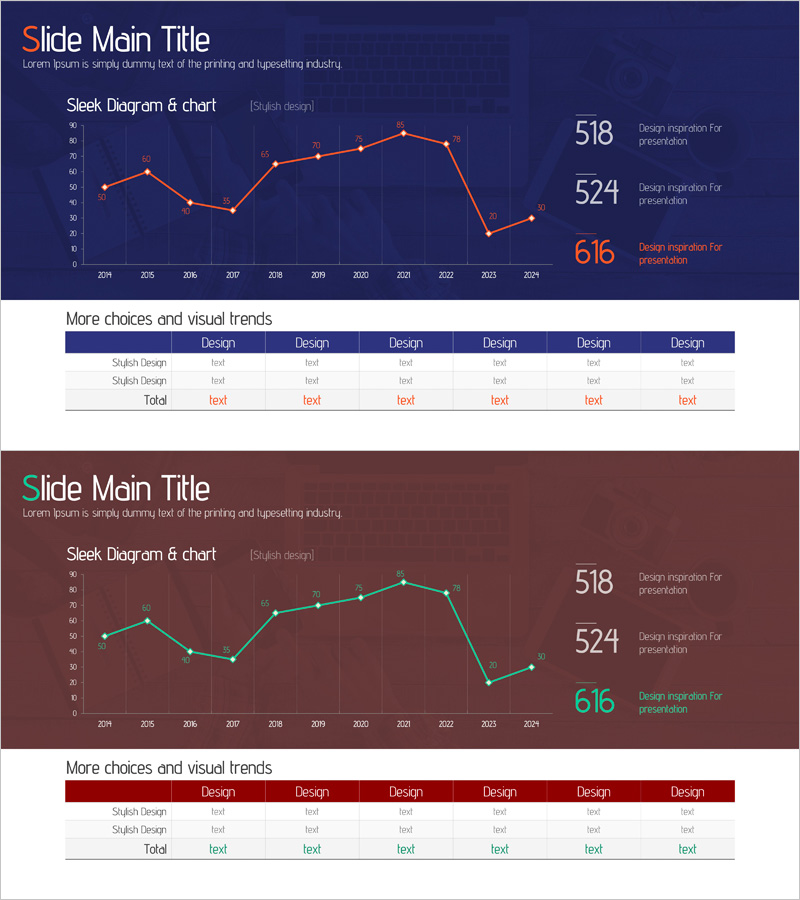
A professional line chart PowerPoint slide visualizing market trends from 2011 to 2024 with 14 data points connected by an orange line on a dark blue background. This presentation slide is ideal for business reports, market analysis presentations, investor pitches, and quarterly performance reviews. The 2-slide set includes two color variations (dark blue and wine red backgrounds) with a grid layout and key metrics highlighted in text boxes on the right side. The PPTX format allows instant editing and customization of data values, line colors, and styling to match your corporate branding.
Usage Points
-
Main Usage
Effectively communicate time-series data such as annual market trends, revenue growth, sales performance, and year-over-year comparisons. The line chart format makes it easy to highlight inflection points and growth patterns, while the accompanying key metrics boxes emphasize critical data points for executive audiences.
-
How to Use
Replace the sample data with your actual figures by editing the chart values directly in PowerPoint. Choose between the dark blue or wine red background version based on your presentation theme and corporate colors. Adjust line colors, grid styling, and text box content to align with your brand guidelines.
-
Recommended For
Executives, financial analysts, marketing strategists, management consultants, and investor relations professionals presenting quarterly results, market analysis, competitive benchmarking, and strategic forecasts. Suitable for board meetings, investor presentations, annual reports, and business development pitches.
-
Slide Structure
2-slide presentation featuring a line chart with 14 data points spanning 2011-2024, gridline background for reference, and three key metric callout boxes (518, 524, 616) positioned on the right. Both dark blue and wine red color variations are included for flexible design options.
Related Products
-

Market Trend Analysis Graph & Table Chart – Insightful Data Visualization
#Market and Competitor Analysis #Diagram #Graph
-

Core Technologies of AI Chipsets: Performance Characteristics
#Market and Competitor Analysis #Diagram #Graph
-

Yellow Red Line Charts and Tables – Market Status Analysis
#Market and Competitor Analysis #Diagram #Graph
-

Year-by-Year Comparative Analysis Line Graph – Market Trend Insights
#Market and Competitor Analysis #Graph #Market Status
