Research Phase Procedure Plan – Visualizing Step-by-Step Schedule
RJ0700012_13
- Last Update 07/25/2025
- File Size 4.9MB
- # of Slides 2
- File Format PPTX
- Slide Ratio 16:9
- Color
Keywords
- #Content-Based Slides
- #Design-Based Slides
- #Business Strategy
- #Operational Plan
- #Diagram
- #Step-by-Step Schedule Plan
- #Business Processes
- #Flow
- #Linear Flow
- #16:9
- #linear diagram PowerPoint slide
- #4-step process diagram
- #research phase template
- #workflow process slide
- #step-by-step planning PowerPoint
About the Product
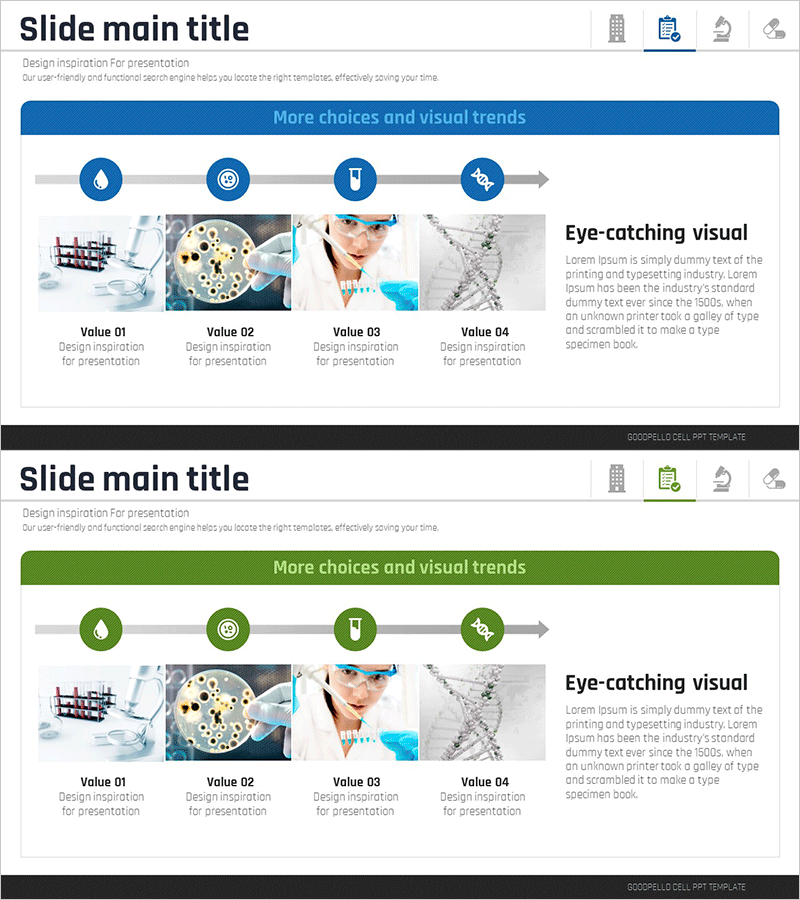
A linear diagram PowerPoint slide that visualizes research phases and procedures through four sequential nodes connected by directional arrows. Each node features a circular icon at the top with descriptive text areas below for entering stage-specific information such as objectives, responsible teams, and timelines. The slide includes two color versions—blue and green—allowing you to match your presentation theme and brand identity. The right side of the slide provides dedicated space for inserting images, photos, or supporting visuals that represent each phase. Designed in 16:9 widescreen format across 2 slides for seamless integration into modern presentations.
Usage Points
-
Main Usage
Ideal for presenting sequential workflows in research projects, product development, business processes, and project management. The four connected nodes and arrows clearly communicate the logical progression of each phase, enabling audiences to grasp the entire process at a glance.
-
How to Use
Enter stage names, objectives, responsible departments, and timelines in the text areas beneath each circular node. Insert relevant photos, charts, or graphics in the right-side image zone to enhance visual impact. Select either the blue or green color version to align with your presentation's visual identity and branding guidelines.
-
Recommended For
Research teams, project managers, consultants, business analysts, and educators presenting step-by-step plans or progress updates. Particularly effective in business plans, project proposals, research reports, training materials, and strategic planning presentations.
-
Slide Structure
Four circular nodes arranged horizontally from left to right, connected by directional arrows indicating process flow. Each node includes a text input area below for stage descriptions. The right side features a dedicated image placement zone for visual content. Available in blue and green color variations.
Related Products
-

Step-by-step Introduction Page – Business Strategy and Operational Planning
#Business Strategy #Operational Plan #Diagram
-

Data Security Plan Linear Diagram
#Business Strategy #Operational Plan #Diagram
-

Business Processes for Service Development - Visualizing Workflow
#Company Introduction #Business Strategy #Operational Plan
-

Financial Business Process Diagram – Roadmap for Efficient Operations
#Business Strategy #Operational Plan #Diagram
